Figures & data
Table 1. Characteristics of children and their mothers in project viva and the generation R study.
Table 2. Association between mid-childhood peripheral blood DNA methylation with mid-childhood atopic sensitization, environmental and food allergen sensitization (top 30 methylation sites are presented here sorted by meta-analysis p-values) .
Figure 1. Miami plots. P values based on meta-analysis results of the associations between cord blood or mid-childhood peripheral blood DNA methylation with mid-childhood atopic sensitization, environmental and food allergen sensitization.
Redline – Bonferroni significance (Bonferroni-adjusted p-value<0.05)Green line – FDR significance (FDR-adjusted p-value <0.05)
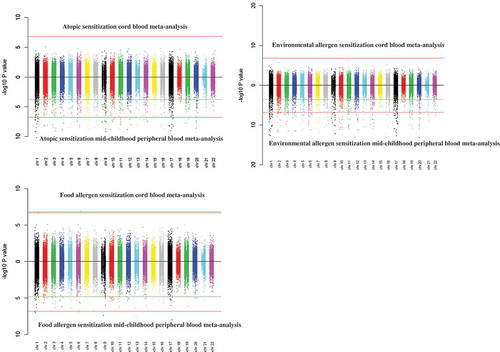
Figure 2. Plots for the associations between EPX, IL5RA, SIGLEC8, IL4 DNA methylation in mid-childhood with mid-childhood atopy (sorted by chromosomal locations) .
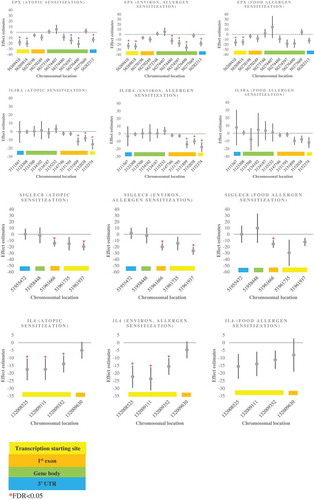
Table 3. Overlapping results of all three phenotypes from the mid-childhood meta-analysis (i.e. methylation sites that met FDR<0.05 for all three phenotypes) .
Figure 3. Venn diagram of overlapping FDR significant methylation sites (mid-childhood cross-sectional meta-analysis) among three phenotypes for the meta-analysis of Project Viva and The Generation R Study.
Table 4. Regional analysis (comb-p) of the association between mid-childhood peripheral blood with mid-childhood atopic sensitization and environmental allergen sensitization.
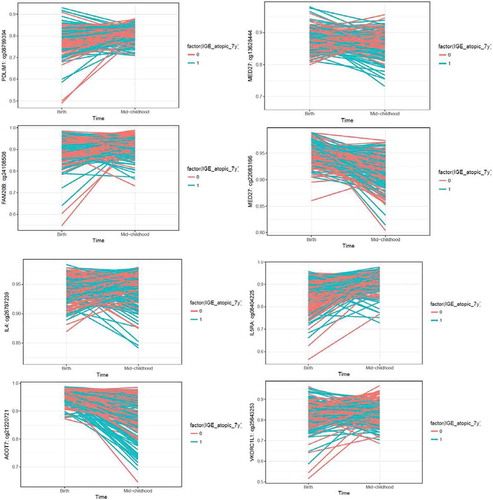
Figure 4. Trajectory plots of methylation changes by atopic status. Methylation sites were selected as they showed nominal significance in the cord blood analysis, and epigenome-wide significance in the mid-childhood analysis. Top 4 plots: top 4 methylation sites sorted by cord blood p-values based on the criteria described above; bottom 4 plots: methylation sites previously shown to be associated with asthma.