Figures & data
Table 1. Characteristics of the study participants at the baseline and repeat measurements.
Figure 1. Replication of associations between DNA methylation in blood and CRP and other circulating inflammatory markers. Each point represents the beta coefficient for a previously reported association between an inflammatory marker and methylation at a CpG site (y-axis) in relation to the beta coefficient for the same association in the current study (x-axis). In (a) Ligthart et al. [Citation9], methylation values were modelled as the outcome, and in (b) Ahsan et al. [Citation10], methylation values were modelled as the exposure. The red line represents an estimated regression line. NPX: Normalized protein expression.
![Figure 1. Replication of associations between DNA methylation in blood and CRP and other circulating inflammatory markers. Each point represents the beta coefficient for a previously reported association between an inflammatory marker and methylation at a CpG site (y-axis) in relation to the beta coefficient for the same association in the current study (x-axis). In (a) Ligthart et al. [Citation9], methylation values were modelled as the outcome, and in (b) Ahsan et al. [Citation10], methylation values were modelled as the exposure. The red line represents an estimated regression line. NPX: Normalized protein expression.](/cms/asset/650a5ad3-4984-4392-9c90-e321b37cf44f/kepi_a_1603962_f0001_c.jpg)
Figure 2. Average within-individual age trajectories for CpG methylation levels. The CpG sites shown demonstrated an association between methylation and levels of an inflammatory protein (in square brackets on the y-axis), as well as a significant change over time (P < 0.0005). Average within-individual age trajectories were estimated in mixed models, including interaction terms between age and the mean protein levels over the two measurements. Marginal effects, depicted as regression lines, were estimated for ages 30 to 60 by the 10th, 50th, and 90th percentiles of the mean inflammatory protein levels.
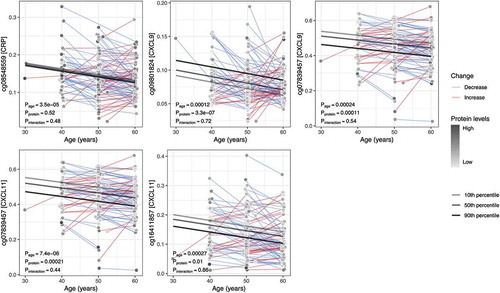
Figure 3. Network of associations between DNA methylation, CRP, and other protein biomarkers. Associations were estimated with mixed models, adjusted for age, sex, case-control status, BMI, smoking status, and technical covariates. Node size corresponds to number of associations (edges). Edge size corresponds to association strength measured as contribution to explained CpG methylation variance by adding the protein biomarker to the model. Edge color represents direction of association, red = positive, blue = negative association. Full network showing all Ligthart et al. [Citation9] CRP-associated CpG sites and Ahsan et al. [Citation10] protein-associated CpG sites available in the study, and all other associations with P < 0.0005 in the current study.
![Figure 3. Network of associations between DNA methylation, CRP, and other protein biomarkers. Associations were estimated with mixed models, adjusted for age, sex, case-control status, BMI, smoking status, and technical covariates. Node size corresponds to number of associations (edges). Edge size corresponds to association strength measured as contribution to explained CpG methylation variance by adding the protein biomarker to the model. Edge color represents direction of association, red = positive, blue = negative association. Full network showing all Ligthart et al. [Citation9] CRP-associated CpG sites and Ahsan et al. [Citation10] protein-associated CpG sites available in the study, and all other associations with P < 0.0005 in the current study.](/cms/asset/513ee2e3-2c86-47be-a5ec-2e1ee1375f3d/kepi_a_1603962_f0003_c.jpg)
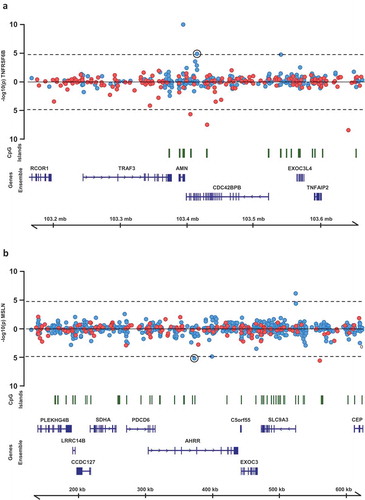
Figure 4. Regional association plots of CpG sites at which methylation levels were associated with multiple protein biomarkers. P-values from mixed models testing the association between (a) TNFRSF6B and CpG sites within 250kb of cg02003183 and (b) MSLN and CpG sites within 250kb of cg02003183. Points above the line represent positive associations between methylation and protein levels, and points below the line represent inverse associations. Blue points represent CpG sites on the Illumina 450k Infinium array, red points represent CpG sites on the Illumina 850k EPIC array.