Figures & data
Table 1. Antibodies and dilutions used for immunohistochemistry and immunofluorescence.
Figure 1. Immunofluorescent double-labelling in the placenta. (a) & (b). Paternally expressed gene 10 (PEG-10; cytotrophoblasts RED) and Pregnancy-specific beta-1-glycoprotein 1 (PSG-1; syncytiotrophoblasts GREEN) in an 8 weeks’ gestation placenta tissue section (a) and trophoblast cells isolated from 15 weeks’ gestation tissue (b). (c). Double-labelling of 5-mC and 5-hmC in a first-trimester placental villous; L-R: 4’,6-Diamidino-2’-phenylindole (DAPI; Blue, Nuclei), 5-hydroxymethylcytosine (5-hmC; Red), 5-methylcytosine (5-mC; Green) and all three images merged.
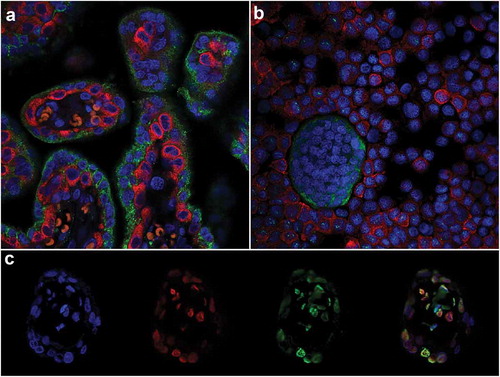
Figure 2. Immunohistochemical labelling of 5-methylcytosine (5-mC) and 5-hydroxymethylcytosine (5-hmC) in first trimester and term tissue sections. (a) & (b). Representative images of 5-mC labelling in a first-trimester section and term tissue section, respectively. (c) & (d). Representative images of 5-hmC labelling in a first-trimester section and term tissue section, respectively. (e). Video image analysis (VIA) quantification of staining intensity revealed an increase in levels of 5-mC in tissue sections from term placenta (n = 17) compared to first trimester (n = 10). (f). There was no difference in the staining intensity of 5-hmC between first trimester (n = 10) and term tissue (n = 17) sections. Data are median and interquartile range. Significance was determined using a Mann-Whitney test. CTB: cytotrophoblast, FC: fetal capillary, IVS: intervillous space, SC: stromal cell, STB: syncytiotrophoblast.
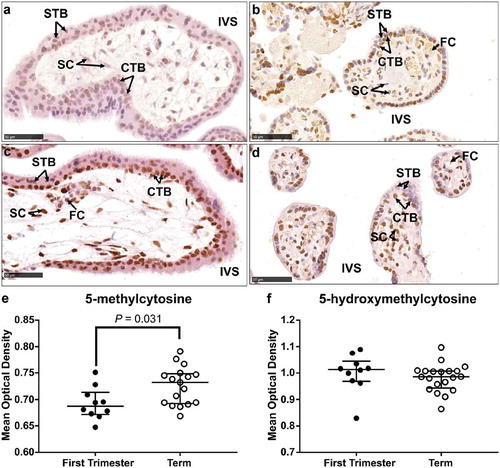
Figure 3. Immunofluorescent labelling of 5-methylcytosine (5-mC) and 5-hydroxymethylcytosine (5-hmC) in cytotrophoblast (CTB) and syncytiotrophoblast (STB) cells isolated from first (6–12 weeks’ gestation) and second trimester (13–22 weeks’ gestation) and term placenta tissue. (a) & (b). Representative images of 4’,6-Diamidino-2’-phenylindole (DAPI; Blue, Nuclei) and 5-mC (Green) staining in cells from second trimester (15 weeks’ gestation) and term, respectively. (c) & (d). Representative images of DAPI (Blue) and 5-hmC (Red) staining in cells from first trimester (7 weeks’ gestation) and term, respectively. (e) & (f). Quantification of staining intensity using ImageJ image analysis software comparing 5-mC and 5-hmC, respectively, between first and second-trimester CTBs and STBs revealed no difference in 5-mC between the trophoblast subtypes however, 5-hmC staining was greater in STBs compared to CTBs. Red dots indicate cells collected from first-trimester placenta tissue whilst black/white dots indicate cells collected from second-trimester tissue. (g) & (h). Increase in levels of both 5-mC and 5-hmC, respectively, were found in CTB cells isolated from term tissue compared to both first and second trimester. Data are median and interquartile range. Significance was determined using a Mann-Whitney test (e & f) or an ANOVA with Tukey posthoc comparison (g & h).
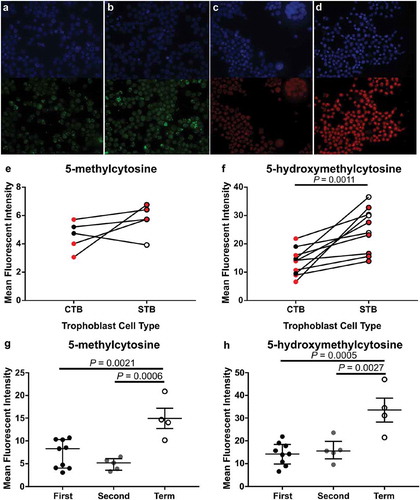
Figure 4. Immunofluorescent labelling of 4’,6-Diamidino-2’-phenylindole (DAPI; Blue, Nuclei), 5-hydroxymethycytosine (5-hmC; Red) and Pregnancy-specific beta-1-glycoprotein 1 (PSG-1; Green, syncytiotrophoblasts (STB)). (a). Representative image of PSG-1 and 5-hmC in a first-trimester placenta tissue section. (b). Quantification of 5-hmC in STB cells across gestation using laser scanning confocal microscopy showed a significant increase in 5-hmC staining intensity in term STBs compared to first and second trimester STBs. Data are median and interquartile range. Significance was determined using an ANOVA with Tukey post-hoc comparison.
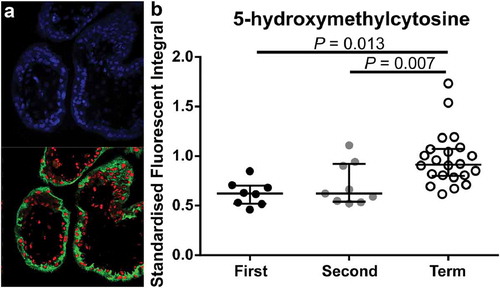
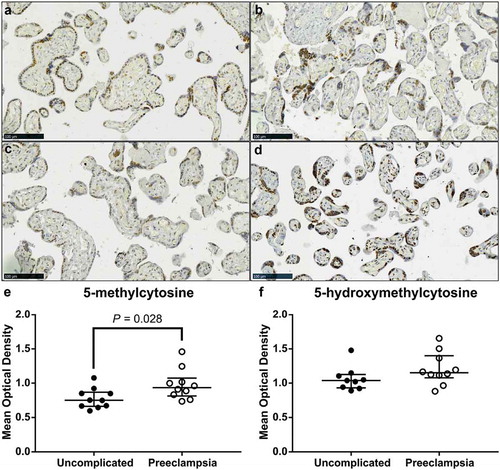
Figure 5. Video image analysis (VIA) of immunohistochemical staining of 5-methylcytosine (5-mC) and 5-hydroxymethylcytosine (5-hmC) in term placenta sections from pregnancies complicated by preeclampsia (PE) and uncomplicated. (a) & (c). Representative images of 5-mC staining in placenta samples from uncomplicated and PE pregnancies, respectively. (b) & (d). Representative images of 5-hmC staining in placenta in an uncomplicated and PE pregnancy, respectively. (e). Intensity of 5-mC staining was greater in tissue sections from PE pregnancies compared to uncomplicated. (f). Staining intensity of 5-hmC did not differ. Data are median and interquartile range. Significance was determined using a Mann-Whitney test.