Figures & data
Figure 1. DMR analysis. The number of DMRs found using different p-value cut-off thresholds. The All Window column shows all DMRs. The Multiple Window column shows the number of DMRs containing ≥2 significant windows. The number of DMR with the number of significant windows at a p-value threshold bolded is presented. (a) E13 primordial germ cells. (b) E16 prospermatogonia. (c) P10 spermatogonia. (d) Pachytene spermatocytes. (e) Round spermatids. (f) Caput epididymal spermatozoa. (g) Cauda sperm.
Figure 2. DMR chromosome location. The DMR locations on the individual chromosomes are presented with red arrowheads and DMR clusters indicated with black boxes. The chromosome number versus the chromosome size (megabase) is presented. (a) E13 primordial germ cells. (b) E16 prospermatogonia. (c) P10 spermatogonia. (d) Pachytene spermatocytes. (e) Round spermatids. (f) Caput epididymal spermatozoa. (g) Cauda sperm.
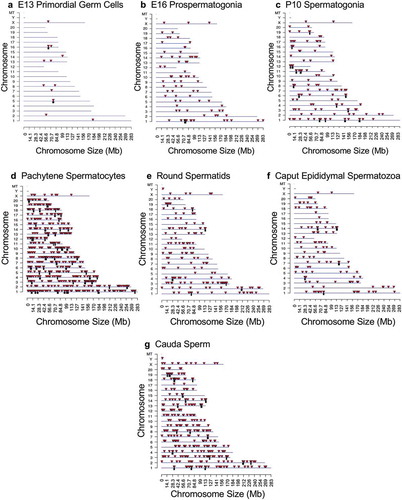
Figure 3. DMR CpG density. The number of DMRs at different CpG densities (CpG per 100 bp) are presented. (a) E13 primordial germ cells. (b) E16 prospermatogonia. (c) P10 spermatogonia. (d) Pachytene spermatocytes. (e) Round spermatids. (f) Caput epididymal spermatozoa. (g) Cauda sperm.
Figure 4. DMR length. The number of DMR at different DMR lengths in kilobases (kb). (a) E13 primordial germ cells. (b) E16 prospermatogonia. (c) P10 spermatogonia. (d) Pachytene spermatocytes. (e) Round spermatids. (f) Caput epididymal spermatozoa. (g) Cauda sperm.
Figure 5. DMR developmental stage overlaps. The DMRs for the different developmental stages (a) are compared to identify overlapping DMRs in the Venn diagram. (b) The comparison of caput and cauda epididymal sperm DMRs in a Venn diagram with PGCs and spermatogonia.
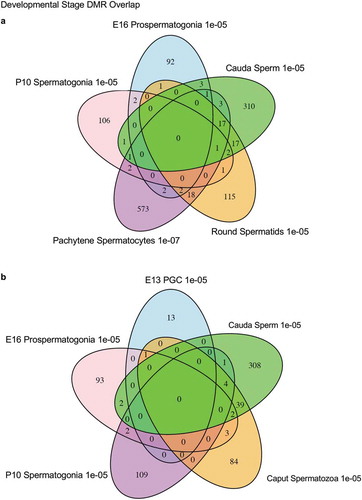
Figure 6. DMR developmental timelines. Top 100 most statistically significant DMR developmental alterations (E13 primordial germ cells, E16 prospermatogonia, P10 spermatogonia, pachytene spermatocyes). The DMRs are separated into two groups based on whether scaled RPKM read depth is elevated in the control or in the exposure lineage. The vinclozolin percent (%) scaled RPKM read depth developmental timelines are presented. (a,b) Top 100 DMRs in the primordial germ cell comparison. (c,d) Top 100 DMRs in the E16 prospermatogonia comparison. (e,f) Top 100 DMRs in the P10 spermatogonia comparison. (g,h) Top 100 DMRs in the pachytene spermatocytes comparison.
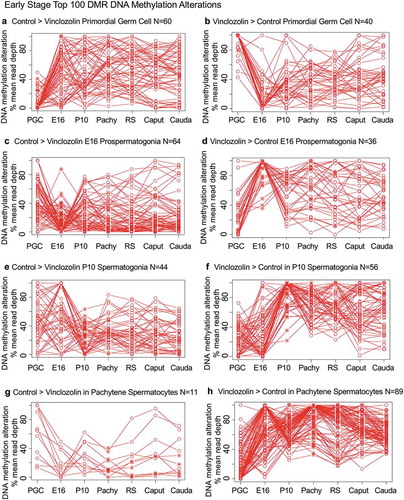
Figure 7. DMR developmental timelines. Top 100 most statistically significant DMR developmental alterations (round spermatids, caput, cauda). The DMRs are separated into two groups based on whether scaled RPKM read depth is elevated in the control or in the exposure. The vinclozolin percent (%) scaled RPKM read depth developmental timelines are presented. (a,b) Top 100 DMRs in the round spermatids comparison. (c,d) Top 100 DMRs in the caput comparison. (e,f) Top 100 DMRs in the cauda comparison.
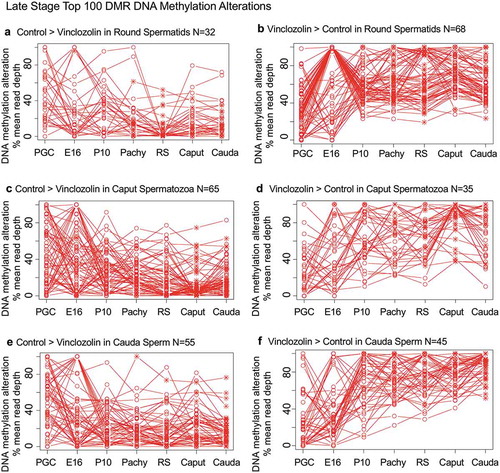
Figure 8. Developmental origins sperm DMR. (a) The origin of DMRs at specific developmental stages for (PGC) primordial germ cells, (E16) prospermatogonia, (P10) spermatogonia, (Pachy) pachytene spermatocytes, (RS) round spermatids, Caput epididymal spermatozoa, and Cauda sperm. The initial developmental stage the cauda sperm DMRs appeared was determined using a relaxed 0.05 edgeR p-value. The numbers of DMRs originating at the different stages are indicated and add to the total 356 DMRs in cauda sperm. (b) Epigenetic and genetic cascade of transgenerational sperm epimutation development scheme. The stages of development for epigenetic and genetic cascades are indicated with epimutation origins correlated to genetic normal or transgenerational modified sperm. Following fertilization, the hypothesis is that the transgenerational epimutations modify early embryonic transcriptomes and epigenomes to re-establish the cascade for the next generation. As the individual develops all somatic cells have altered epigenomes and transcriptomes to promote disease susceptibility later in life. (c) Vinclozolin and DDT transgenerational developmental DMR comparisons with the overlapping DMRs indicated. The DMRs at each stage of development are listed and overlapping numbers. The DMR p-value is p < 1e-05 for all except the vinclozolin pachytene at p < 1e-07.
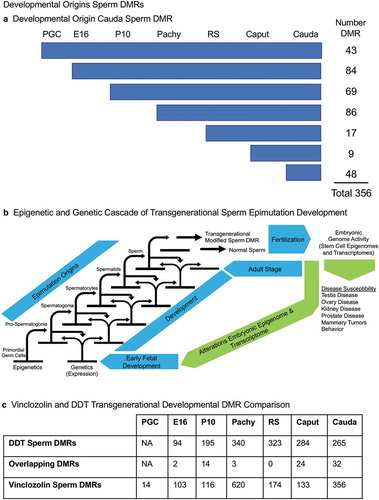
Figure 9. DMR associated gene categories and pathways. (a) The DMR associated gene functional categories are presented for each stage of development, indicated in the inset, with number of DMRs for each category. (b) The DMR associated gene pathways for each developmental stage with the pathway indicated and number of genes in brackets.