Figures & data
Table 1. Subject characteristics.
Table 2. Subject neuropathy phenotyping.
Figure 1. Distribution of percentage methylation within groups. This histogram illustrates the overall distribution of the percent methylation of the measured 1,527,600 CpG sites. The boxes within each panel represent zoomed-in images covering the percent methylation between 90% and 100%.
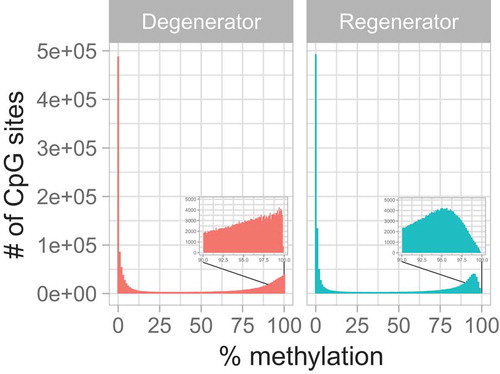
Figure 2. Distribution of DMCpGs (degenerators compared to regenerators) according to the gene region. (a) Pie chart showing the percentage of DMCpGs located in promoters, exons, introns, and intergenic regions. (b) Pie chart showing the percentage of DMCpGs located in CpG islands (CpGi), CpG shores (regions within 2 kb of a CpG island), and others.
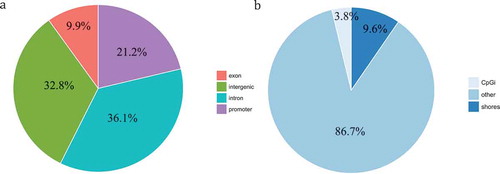
Table 3. Top 15 differentially methylated CpGs and their annotated genes.
Figure 3. GO enrichment analysis of sural nerve DMGs (degenerators compared to regenerators). The top 20 most significantly enriched GO terms among DMGs are shown. Rich factor is the proportion of DMGs to all genes belonging in each GO term. The values on each bar correspond to the numbers of DMGs in each GO term, and colour gradient (see colour scale right of the figure) indicates the level of significance.
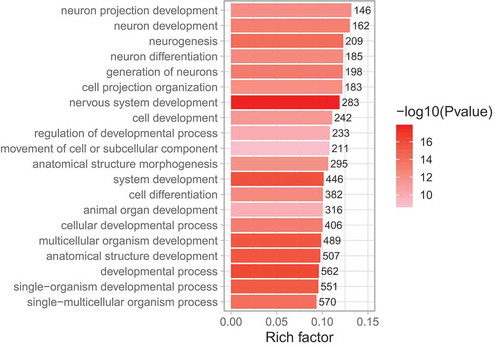
Figure 4. KEGG pathway enrichment analysis of sural nerve DMGs (degenerators compared to regenerators). All significantly enriched KEGG terms among DMGs are shown. Rich factor is the proportion of DMGs to all genes belonging in each KEGG pathway. The size of dot corresponds to the numbers of DMGs in each KEGG pathway, and colour gradient (see colour scale right of the figure) indicates the level of significance.
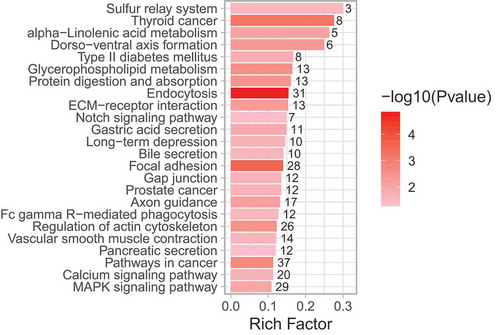
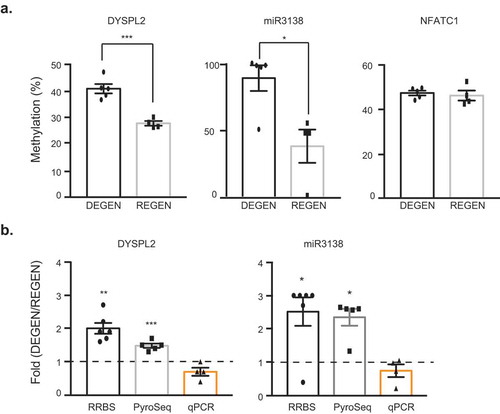
Figure 5. Cross-validation of methylation profiling and sequence-specific methylation of DYSPL2 and miR3138. (a) Percent CpG methylation for DPYSL2, miR3138, and NFATC1 measured by conventional pyrosequencing. The data are presented as mean ± SEM, and an unpaired t-test was used. (b) Methylation and gene expression fold change in the degenerators relative to the regenerators within analysis platform (RRBS, pyrosequencing, and qPCR). Dashed line represents the average gene expression by qPCR analysis of the regenerator group. *p < 0.05, **p < 0.01, ***p < 0.001. For RRBS: DEGEN n = 6; REGEN n = 4. For pyrosequencing: DEGEN n = 5; REGEN n = 4. For qPCR: DEGEN n = 4, REGEN n = 3.