Figures & data
Figure 7. Proposed mechanism of FA-induced global DNA hypomethylation in HepG2 cells. FA induces global DNA hypomethylation by decreasing the mRNA and protein expression of DNMT1, DNMT3A, and DNMT3B. The decrease in DNMTs is caused by promoter hypermethylation of DNMT1 and DNMT3B, and promoter hypomethylation and upregulation of miR-29b. MiR-29b negatively regulates the mRNA expression of DNMT1, DNMT3A, and DNMT3B. In addition, FA may also induce global DNA hypomethylation by causing promoter hypomethylation and upregulation of MBD2.
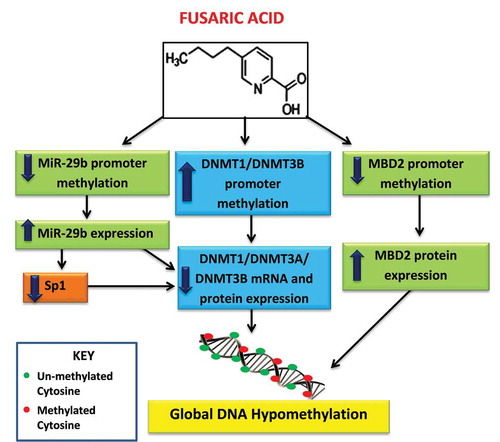
Figure 1. Fusaric acid induced global DNA hypomethylation in HepG2 cells. DNA isolated from control and FA-treated HepG2 cells were assayed for global DNA methylation by quantifying 5-methylcytosine using a Colorimetric Methylated DNA Quantification Kit. Fusaric acid decreased the percentage of 5-methylcytosine in HepG2 cells compared to the control. Results are represented as mean fold-change ± SD (n = 3). Statistical significance was determined by one-way ANOVA with the Bonferroni multiple comparisons test (**p < 0.005, ***p < 0.0001).
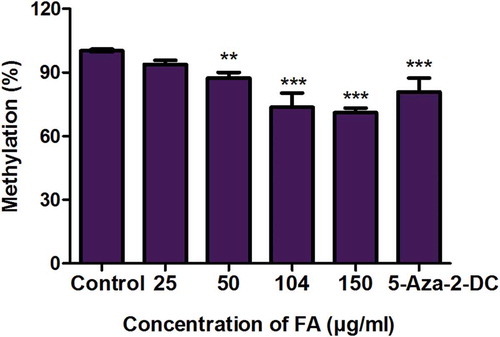
Figure 2. The effect of FA on DNA methyltransferases in HepG2 cells. (a) RNA isolated from control and FA-treated HepG2 cells were reverse transcribed into cDNA and analyzed by qPCR. Fusaric acid significantly decreased the mRNA expression of DNMT1, DNMT3A, and DNMT3B in HepG2 cells. (b) Protein expression of DNMT1, DNMT3A, and DNMT3B were determined by Western blot. Fusaric acid decreased the protein expression of DNMT1, DNMT3A, and DNMT3B in HepG2 cells. Results are represented as mean fold-change ± SD (n = 3). Statistical significance was determined by one-way ANOVA with the Bonferroni multiple comparisons test (*p < 0.05, **p < 0.005, ***p < 0.0001).
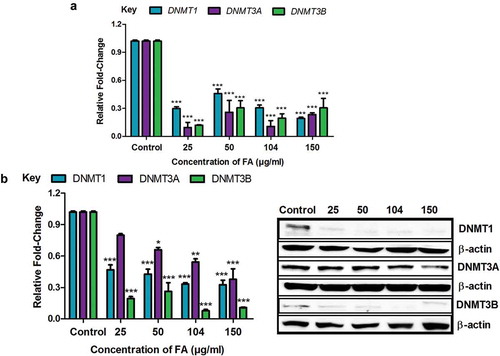
Figure 3. The effect of FA on the promoter methylation of DNMT1, DNMT3A, and DNMT3B in HepG2 cells. DNA isolated from control and FA-treated HepG2 cells were assayed for DNMT promoter methylation using the OneStep qMethyl Kit. Fusaric acid induced promoter hypermethylation of DNMT1 and DNMT3B, and altered promoter methylation of DNMT3A in HepG2 cells. Results are represented as mean fold-change ± SD (n = 3). Statistical significance was determined by one-way ANOVA with the Bonferroni multiple comparisons test (***p < 0.0001).
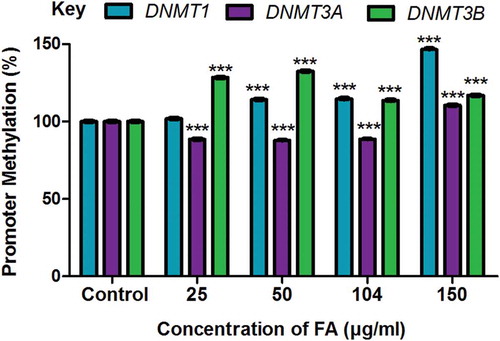
Figure 4. The effect of FA on miR-29b and Sp1 in HepG2 cells. (a) DNA isolated from control and FA-treated HepG2 cells were assayed for miR-29b promoter methylation using the OneStep qMethyl Kit. Fusaric acid induced promoter hypomethylation of miR-29b in HepG2 cells. (b) RNA isolated from control and FA-treated HepG2 cells were reverse transcribed into cDNA and analyzed by qPCR. Fusaric acid significantly increased the expression of miR-29b in HepG2 cells. (c) TargetScan analysis of miR-29b to the 3ʹUTRs of DNMT3A, DNMT3B, and Sp1. (d) RNA isolated from control and FA-treated HepG2 cells were reverse transcribed into cDNA and analyzed for Sp1 expression by qPCR. Fusaric acid decreased the mRNA expression of Sp1 in HepG2 cells. Results are represented as mean fold-change ± SD (n = 3). Statistical significance was determined by one-way ANOVA with the Bonferroni multiple comparisons test (***p < 0.0001).
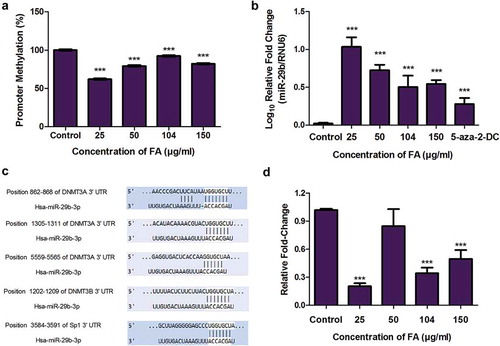
Figure 5. The effect of FA on the ubiquitination of DNMT1, DNMT3A, and DNMT3B in HepG2 cells. (a) The ubiquitination of DNMT1, DNMT3A, and DNMT3B were detected by immuno-precipitation and Western blot. Fusaric acid altered the ubiquitination of DNMT1, DNMT3A, and DNMT3B in HepG2 cells. (b) RNA isolated from control and FA-treated HepG2 cells were reverse transcribed into cDNA and analyzed by qPCR. Fusaric acid significantly decreased the expression of UHRF1 and USP7 in HepG2 cells. Results are represented as mean fold-change ± SD (n = 3). Statistical significance was determined by one-way ANOVA with the Bonferroni multiple comparisons test (*p < 0.05, **p < 0.005, ***p < 0.0001).
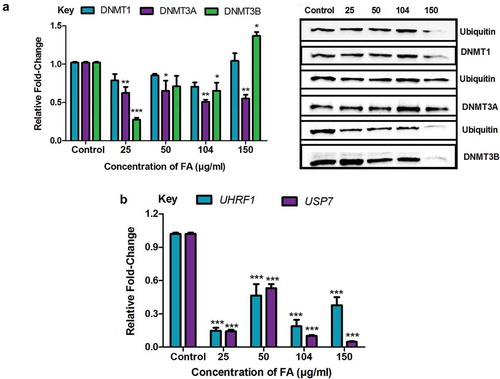
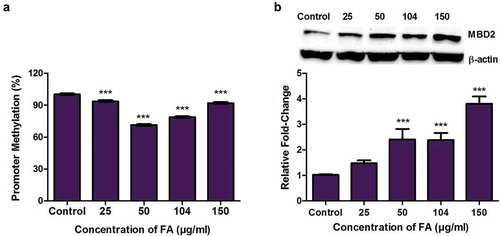
Figure 6. The effect of FA on MBD2 promoter methylation and MBD2 expression in HepG2 cells. (a) DNA isolated from control and FA-treated HepG2 cells were assayed for MBD2 promoter methylation using the OneStep qMethyl Kit. Fusaric acid significantly induced promoter hypomethylation of MBD2 in HepG2 cells. (b) Protein expression of MBD2 was determined by Western blot. Fusaric acid significantly increased the protein expression of MBD2 in HepG2 cells. Results are represented as mean fold-change ± SD (n = 3). Statistical significance was determined by one-way ANOVA with the Bonferroni multiple comparisons test (***p < 0.0001).