Figures & data
Figure 1. Average weight of Nile tilapia, according to sex and weight (n = 6). Large females were statistically heavier than small females (t-test, p-value <0.001) and lighter than large males (t-test, p-value <0.001), while small males were statistically lighter than large males (t-test, p-value <0.001) and heavier than small females (t-test, p-value <0.001).
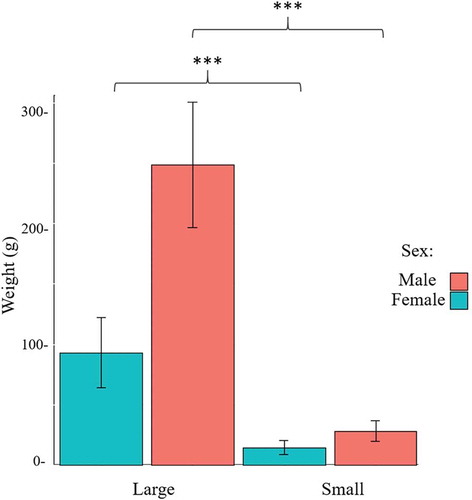
Figure 2. Number of total raw (dark grey), quality-trimmed (light grey), adapter-trimmed (purple), uniquely mapping (green), and multiple mapping (red) reads in the group of large and small females and males, respectively.
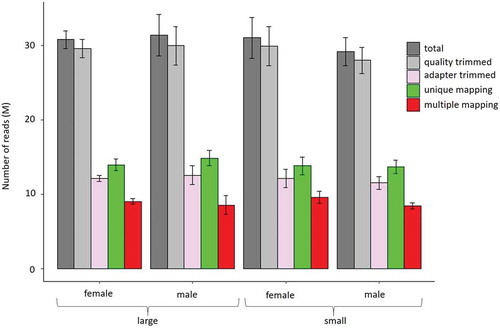
Table 1. Global cytosine methylation level in CpG, CHG, and CHH contexts; number of cytosines analysed and cytosine coverage with respect to the whole Nile tilapia genome.
Figure 3. Heat map of methylation levels of 234,755 CpG sites distributed across the Nile tilapia linkage groups (columns) and separated in sex- and weight-specific groups (rows, n = 6). Methylation levels below 40%, between 40% and 60%, and above 60% are indicated in blue, yellow, and red, respectively.
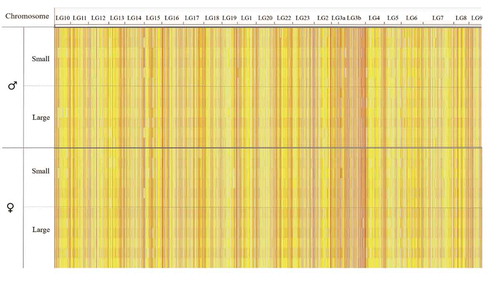
Figure 4. Genomic context of CpG sites found in the whole genome (a) and in the reduced representation dataset (b).
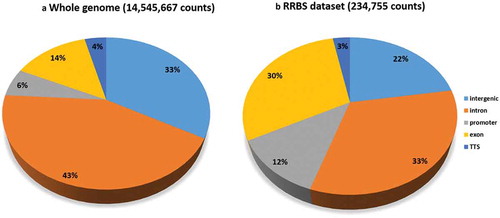
Figure 5. Genomic context of sex-specific differentially methylated cytosines (hypo- and hypermethylated). Twelve fish per sex and 234,755 cytosine positions in total were compared.
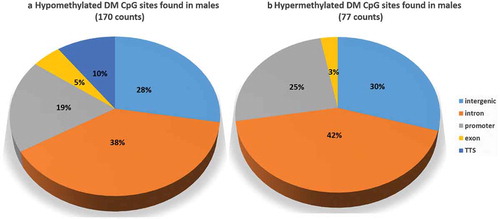
Table 2. List of functionally relevant genes associated with CpG sites that are differentially methylated between sexes in Nile tilapia.
Figure 6. Chromosomal distribution of weight-specific differentially methylated CpG sites in females (1128 positions) and males (970 positions). Small individuals are set as reference for both sexes separately. Methylation differences in males are represented in the inner circle (blue background) and those of females in outer circle (grey background). Histograms pointing inwards (dark green) and outwards (dark red) represent hypomethylated and hypermethylated sites, respectively.
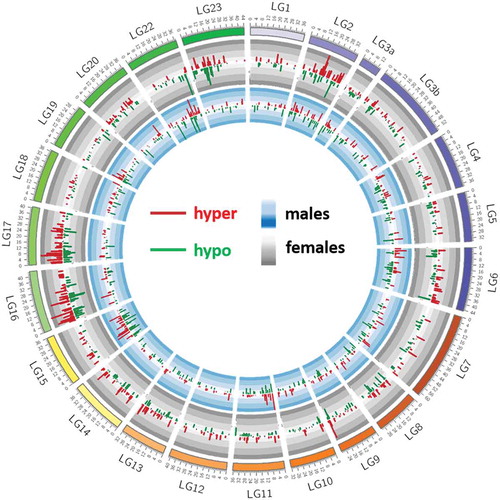
Table 3. List of functionally relevant genes associated with weight-related DM CpG sites that are found separately in both sexes in Nile tilapia.
Table 4. List of functionally relevant genes associated with DM CpG sites related to growth in Nile tilapia.
Figure 7. Schematic representation of genes associated with differentially methylated CpGs in the comparison between males (a), females (b), growth (c), or sex (d) and that play a role in muscle growth or epigenetic regulation processes. Genes in black are specific to one comparison, whereas genes in red are associated with differentially methylated CpGs in more than one comparison. In the male-specific comparison, gadd45g is connected to several other differentially methylated genes. Gadd45g activates the p38MAPK pathway, which is important in muscle growth and regeneration.
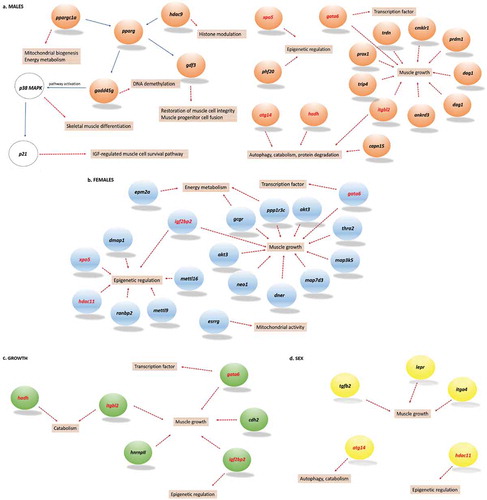
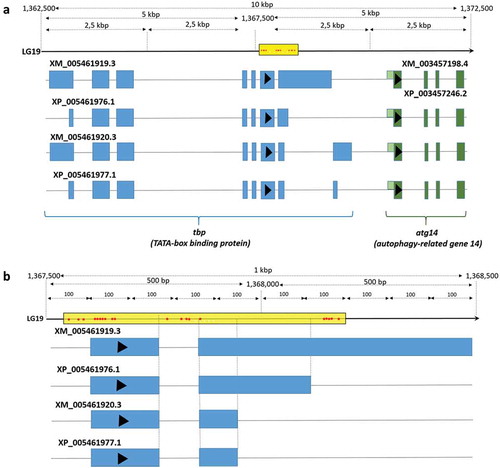
Figure 8. Location at 10k (a) and 1k (b) base pair resolution of 20 DM CpG sites situated within introns and exons of tbp2 (TATA-box binding protein 2) and associated with the transcription starts site (TSS) of atg14 (autophagy-related gene 14).