Figures & data
Figure 1. Diagram illustrating CpG selection.
Illumina = Infinium Human Methylation450 BeadChips IMI = Italian Mediterranean Index
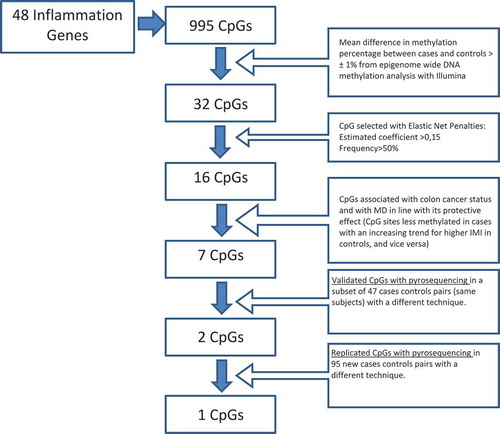
Figure 2. Diagram illustrating the data sets used in the different stages of the analysis.
ca = casesco = controls Illumina = Infinium HumanMethylation450 BeadChips pyro = pyrosequencing.
Table 1. Descriptive statistics of the case-control study nested in the EPIC-Italy cohort.
Table 2. CpG sites selected by EN with 10-fold CV with an estimated coefficient higher than 0.15 in absolute value in the case-control study nested in the EPIC-Italy cohort.
Table 3. Detailed analysis of the CpG sites Selected for Validation (those reported in with a frequency higher than 50% and an association with MD in the control group in line with its protective effect).
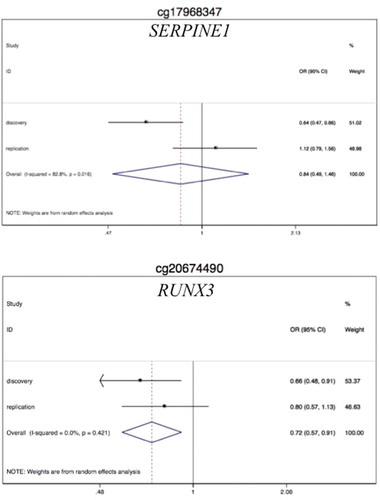
Table 4. Validation analysis: associations between colon cancer/MD and DNA methylation levels at SERPINE1 and RUNX3 CpG sites obtained by pyrosequencing in the validation set.
Table 5. Replication analysis: Associations between colon cancer/MD and DNA methylation levels at SERPINE1 and RUNX3 CpG sites obtained by pyrosequencing in the replication set.
Figure 3. Results of the mixed effects meta-analysis of the discovery and replication studies on the validated signals.