Figures & data
Table 1. Characteristics of the members of the Michigan PBB Registry with epigenetic data.
Figure 1. SEMs can be replicated in longitudinal repeats. Because DNA methylation levels were measured in longitudinal repeats for 14 individuals, with the first sample taken in 2004, and the second sample taken between 2012 and 2015 (designated below by the Subject ID followed by 1 or 2 to indicate the first or second sample), SEMs were calculated in both of these samples to see if they could be replicated. The SEM calls were highly correlated within the longitudinal pairs (r = 0.55–0.77) and not correlated within samples that were non-longitudinal pairs (r = 0.00–0.10), indicating that SEMs are not just the result of technical error, and can be replicated. In a majority of individuals (64.28%), the number of SEMs increased between samples (mean: 22.1447.64).
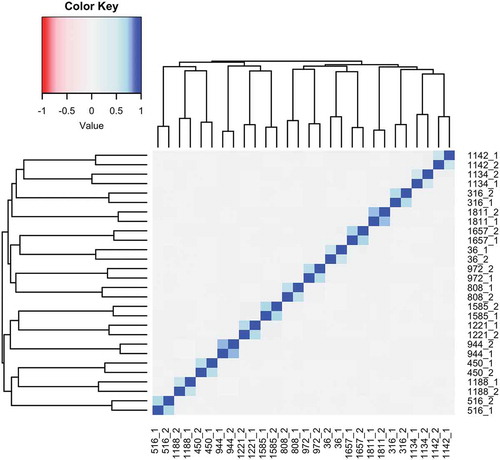
Figure 2. Higher SEM count associates with higher exposure to PBB in those exposed when they were older. The interaction between age of exposure and current total PBB level is associated with the number of SEMs (z = 2.27; p = 0.02). The association between total PBB and SEMs was only significant in participants who were exposed when they were older (black triangles, solid line) (z = 2.22; p = 0.02). For participants exposed to PBB when they were younger, the association between PBB and SEM count was not significant (grey circles, dashed line) (t = 0.20; p = 0.91). Figure was plotted on a log10 scale for ease of interpretation, but the statistical analysis was done as described in methods.
Table 2. People in the Michigan PBB Registry have SEMs enriched in biological pathways related to xenobiotic metabolism and hormone regulation.
Figure 3. Higher number of SEMs is associated with age acceleration. The number of SEMs is positively associated with two measures of age acceleration (intrinsic: z = 3.13, p = 1.70e-3, Part A; extrinsic: z = 6.61, p = 3.59e-11, Part B), even when adjusted for age, sex, and estimated cell type proportions. Figure was plotted on a log10 scale for ease of interpretation, but the statistical analysis was done as described in methods.