Figures & data
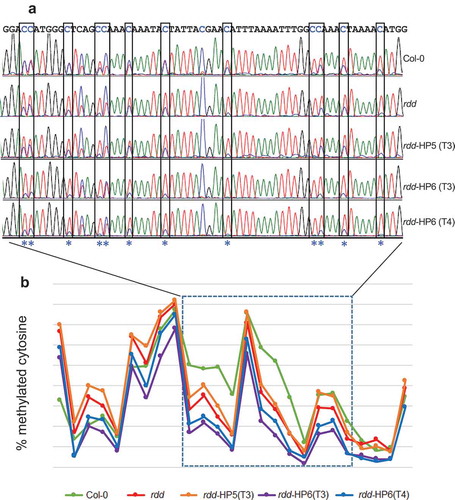
Figure 1. Schematic diagrams of the promoter:GUS fusion constructs and the DME hairpin RNA (hpDME) construct. Transposable element (TE) sequences are indicated in brown; blue regions indicate the GUS coding sequence. Numbers indicate the nucleotide position relative to the transcription start site (TSS).
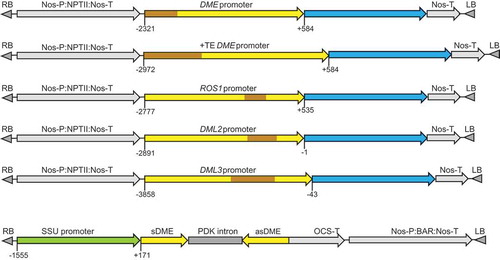
Figure 2. Representative expression patterns of the promoter:GUS fusion transgenes in Arabidopsis Col-0 ecotype. Arrow indicates DML3p:GUS expression in anthers of young flowers.
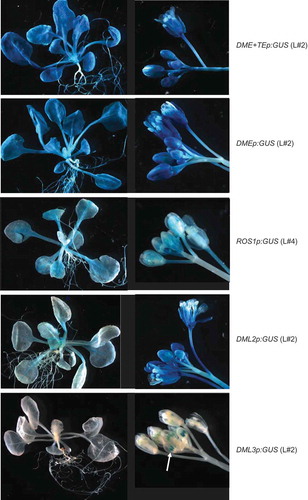
Figure 3. Northern blot analysis to detect DME mRNA level in Col-0, rdd and rdd DME RNAi transformants (rdd-HP5 and rdd-HP6). Top panel: Northern blot analysis probed with antisense DME RNA, which allows detection of both the DME mRNA and the hpDME-derived transcript. Bottom panel: Ethidium bromide-stained RNA agarose gel to show even loading of RNA.
Figure 4. Knockdown of DME expression in rdd increases susceptibility to Fusarium oxysporum infection. Left panel: plants infected with Fusarium for 8 days at 23°C on sucrose-free MS medium. Right panel: histogram showing disease score based on the number of chlorotic leaves in each plant. Disease scoring was carried out in biological triplicates using 20–30 plants per replicate. The diagram was drawn using the software at https://github.com/wangqinhu/aid. Significance testing was performed using the Wilcox test: **p < 0.01, ***p < 0.001.
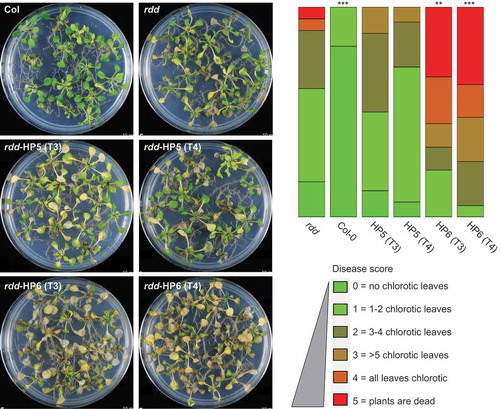
Figure 5. The expression levels of rdd-downregulated defence-related genes is further repressed by DME knockdown. Whole 3-week-old plants of around 20 individual siblings for each plant line were analysed as a pool. Columns indicate the average of three technical replicates with error bars showing standard deviation. The Actin 2 gene was used as internal reference for RT-qPCR.
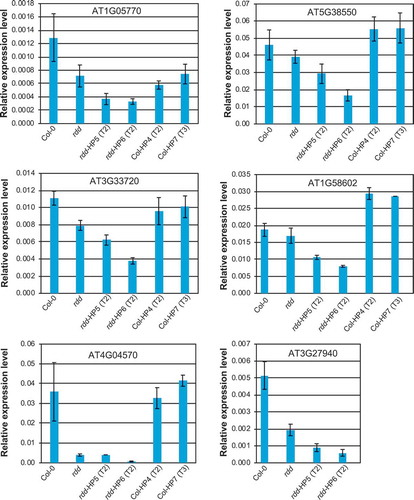
Figure 6. DME RNAi causes a further reduction in CHH methylation at the rdd-controlled promoter TE region of AT3G27940. a: Representative bisulfite sequencing trace file of the region showing CHH methylation changes. The CHH sites are boxed and indicated with asterisks. The ratio between blue and overlapping red peaks indicates the level of cytosine methylation. b: Cytosine methylation level of the whole bisulfite sequenced region. Each point represents one cytosine residue in the CHH context. The section for which the trace file image is shown is indicated.