
Figures & data
Figure 1. OTA inhibited the cell cycle progression of HKC cells. (A) Semiquantitation of the diploid analysis by flow cytometry. HKC cells were treated with 0 μM, 5 μM, 10 μM, 20 μM, and 40 μM OTA for 24 h, respectively. The values were expressed as the mean ± SD for three biological replications. Different lowercase letters indicate significant differences (p < 0.05). (B) Cell cycle histograms of cells exposed to 5 μM, 10 μM, 20 μM, and 40 μM OTA or to serum-free medium as a CK for 24 h, respectively. Data are shown for one representative experiment.
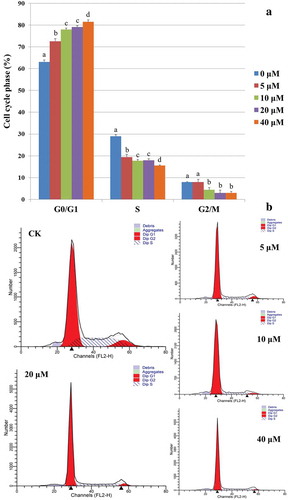
Figure 2. Single cell immunofluorescence revealed an increased expression of DNMT1 corresponded to the DNA content during cell cycle progression in HKC cells. (A) Three gates based on DNA content (intensity of Ch07) were set. R3, R4, and R5 represent the G0/G1, S, G2/M phase, respectively. (B) Semiquantitation of the DNMT1 expression in each cell cycle phase and each group was obtained using the IDEAS analysis software. Each calculated mean value was normalized with that of G0/G1 phase of CK, representing a relative expression level. The resulting ratio in the G0/G1 phase of CK was normalized to 1. (C) The visualization of DNMT1 expression in randomly selected single cells. Images in channel 01 (Ch01) were captured in the wild field. Signals from Alexa Fluor 488 and Hoechst 33,342 were captured in Ch02 and Ch07, respectively. Merged images are shown in Ch02/Ch07. Representative cells in the left lane are from group CK: No. 18,545 at G0/G1, No. 456 at S, and No. 18,500 at G2/M phase, respectively. Representative cells in the right lane are from group OTA: No. 77 at the G0/G1, No. 15,716 at S, and No. 734 at G2/M phase, respectively.
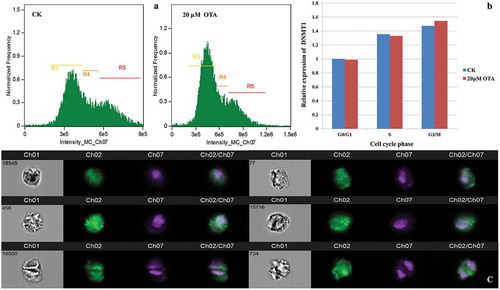
Figure 3. The heatmap for the bin-wise mC levels. Color indicates the average methylation levels in bins across the entire genome (bin size: 5M bp). Green bars on the right indicate the global average DNA methylation levels of each sample.
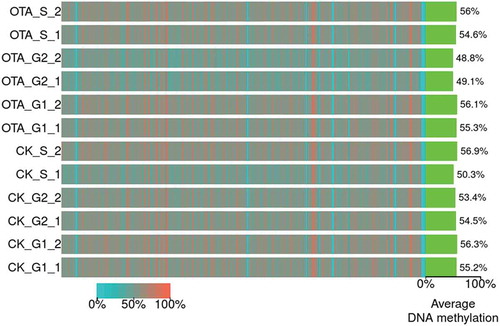
Figure 4. Overview of the DMR and DMG. (A) Venn diagram showing the numbers of DMRs and DMGs. The numbers of up-regulated and down-regulated DMGs were shown above and below the middle line, respectively. (B) Pie chart showing the percentage of the genomic locations of the DMR candidates.
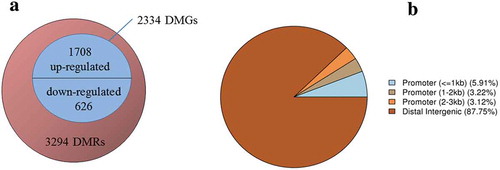
Figure 5. Functional classification of identified DMGs and DEGs as a result of OTA treatment. The GO biological processes (A) and molecular functions (B) of the DMGs, while biological processes (C) and molecular functions (D) of DEGs were categorized using the PANTHER classification system.
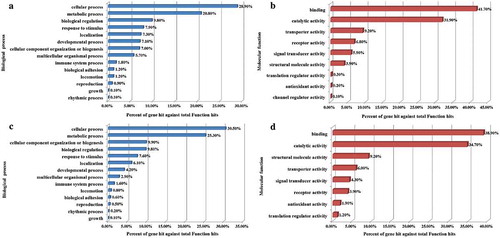
Figure 6. Overview and unsupervised hierarchical clustering of FPKMs across all 12 samples in the two groups. (A) Boxplot of log2(FPKM+1) showing the distribution of FPKMs across all the samples. (B) Unsupervised hierarchical clustering heatmap. A total of 5009 genes were used for clustering, selected by 1< maximum FPKM<15 and the standard deviation of log2(FPKM+1)>1.
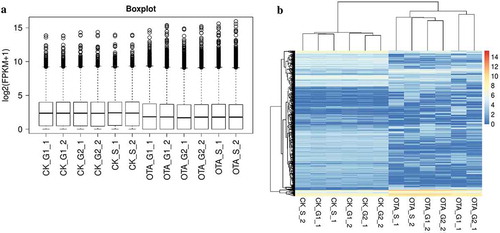
Table 1. List of cell cycle progression related genes which altered in both the methylome and transcriptome profiling after OTA treatment.
Figure 7. PCR validation of the mRNA expression of selected DEGs. * indicates significant differences (p < 0.05).
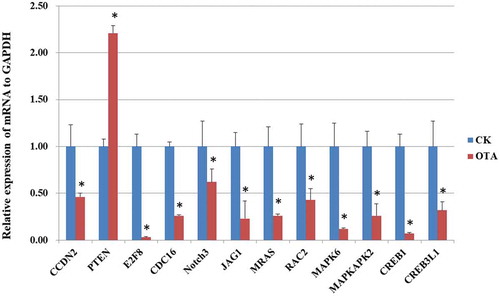
Table 2. Signaling pathways enriched by integrated analysis of DMGs and DEGs after OTA treatment.
Figure 8. A hypothetical mode of action for OTA-induced G0/G1 cell cycle arrest in HKC cells. The key down-regulated genes were shown in red while up-regulated genes were shown in green. Genes with a green circle represented its DNA hypermethylation while red circle represented the DNA hypomethylation.
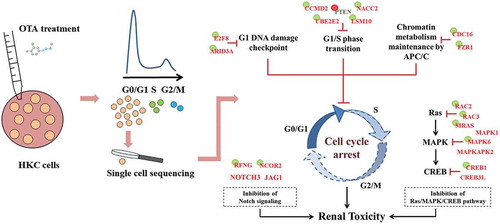
Table 3. Gene specific primers used in real-time qPCR analysis.