Figures & data
Table 1. Demographic characteristics of AMIGOS males. All values are reported as the mean (range) for A) the 32-sample subset and full AMIGOS study and B) the three BMI category groups; healthy (BMI < 25 kg/m2), overweight (BMI 25–30 kg/m2) and obese (BMI > 30 kg/m2).
Figure 1. BMI responsive sperm RNA element (SRE) clusters. Response clusters identified in Mfuzz include 235 SREs that follow 8 unique cluster patterns. General responses are comprised of (a) 3 cluster patterns that respond with a general steady increase with body mass index (BMI) indicated by the red section of the pie chart in the upper left-hand corner. (b) Two cluster patterns that follow a general BMI response of increasing once obese. These clusters are indicated by the orange pie chart section in the upper left-hand corner. (c) Two clusters indicated by the blue pie chart section in the lower left-hand corner comprise a general steady decrease as BMI increases. (d) One cluster indicated with the green slice of the pie chart in the lower left-hand corner responded to BMI with a decrease once overweight. Clusters were determined from the significant 487 SREs identified by the generalized linear model (GLM). BMI category; healthy (< 25 kg/m2), overweight (25–30 kg/m2) and obese (30+ kg/m2), group means were assigned. The Mfuzz algorithm was set to cluster only those SREs with mean reads per kilobase per million (RPKM) > 10 in at least one BMI group and follow the cluster pattern with a membership of 0.4. Graphs are visualized across BMI groups based on expression fold-change of the cluster pattern.
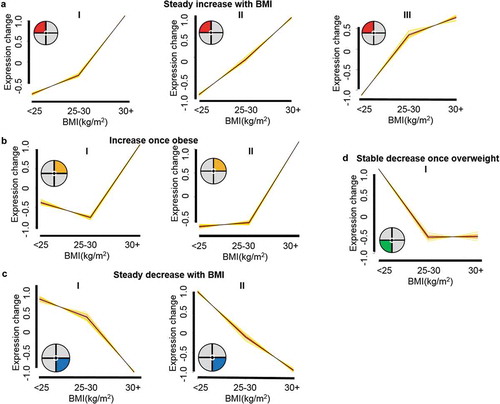
Figure 2. Obesity related impact on sperm. Increased BMI induces the obesity-related hallmarks adipogenesis, stress and low-grade systemic inflammation within the epididymal white adipose tissue (eWAT) to alter the sperm environment. The altered sperm environment changes sperm RNAs regulated by Chromatin remodeler cofactors, RNA interactors, Erasers and Writers (CREWs) of methylation, acetylation and ubiquination to impact sperm characteristics and function.
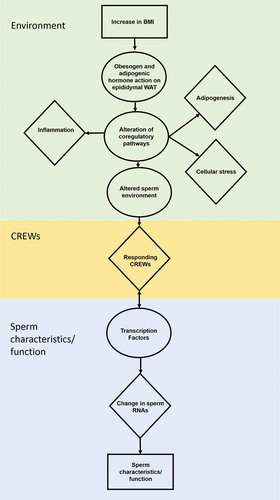
Table 2. Transcript integrity for Chromatin remodeler cofactors, RNA interactors, Erasers and Writers (CREWs) also found in the sperm proteome that are associated with BMI. MAZ and NFAT are indicated with an * as the NFAT members NFAT3 and NFAT4, along with MAZ are present as a full-length transcript. Slope refers to the change in SRE abundance (RPKM) as BMI is increased by a single integer while BMI Response informs whether the SRE is present within one of the four over-all responses; steady increase with BMI, increase once obese, steady decrease with BMI and stable decrease once overweight, or is only associated (positive, negative) with BMI from the generalized linear model.
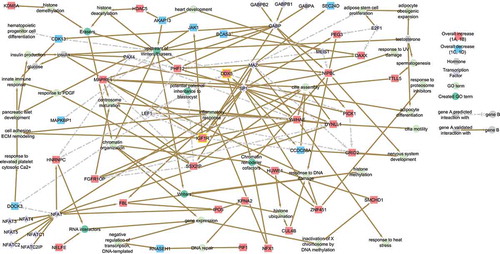
Figure 3. Network of the 24 CREWs correlated with BMI. Chromatin remodeler cofactors, RNA interactors, Erasers and Writers (CREWs) involved in chromatin organization within the 487 SREs associated with BMI acting as key regulators of the obesity related pathways. Yellow boxes highlight the location of IGF1R (center) and the Chromatin remodeler cofactor DDX5 (center) which act as a feedback loop continuing the progression of obesity altered insulin signaling. Line color indicates whether the reported interaction is validated (solid brown) or predicted (dashed light grey).
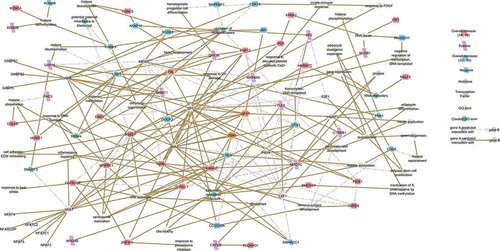
Figure 4. Network of the 12 CREWs responsive to BMI. Chromatin remodeler cofactors, RNA interactors, Erasers and Writers (CREWs) involved in chromatin organization within the 235 MFuzz BMI responsive SREs acting as key regulators of the obesity-related pathways. Yellow boxes highlight the location of IGF1R (center) and the Chromatin remodeler cofactor DDX5 (center) which act as a feedback loop continuing the progression of obesity-altered insulin signaling. Line color indicates whether the reported interaction is validated (solid brown) or predicted (dashed light grey).