Figures & data
Table 1. Characteristics of real-time PCR primers in this study.
Figure 1. Schematic map of the ribosomal DNA (rDNA) Repeat and validation of the Real-Time/quantitative PCR (qPCR) approach taken in this study. (a) The 45S rDNA repeat showing how the structure of the 45S primary rRNA transcription unit corresponds to the post-processed 18S, 5.8S, and 28S rRNA subunits. Locations of the primer sets are indicated. NTS = Non-transcribed Spacer, IGS = Intergenic Spacer, ETS = External transcribed spacer/sequence, ITS = Internal transcribed spacers/sequences. (b) Responsiveness of qPCR crossing thresholds (Ct) to DNA concentration for three different primer sets in (A) (see also ), including regression coefficient m (of y = mx+b) and coefficient of determination (R2) of the lines. Graphs that do not have numerical ordinal values share an ordinate with other graphs in the same row. (c) Correlations between qPCR amplifications of the subunits of the 45S unit at four different DNA concentrations (from left to right, 0.1 ng, 1 ng, 10 ng, and 100 ng). (d) Determination of human 18S rDNA copy number (using 18S.12 primer set) from 10 ng template DNA, by normalization to human tRNAMet gene copy number (see ), in the presence of different concentrations of competing Drosophila DNA. (e) Determination of human rDNA copy number from varied amounts of template DNA, by normalization to human tRNAMet gene copy number, in the presence of competing Drosophila genomic DNA such that the total concentration of template DNA was kept constant at 16 ng. Data from (D) are included in this graph as the green, yellow, and orange data points. (f) Correlation between copy number determination of enhanced GFP (eGFP) and human Bloom Syndrome helicase (BLM) from cell lines bearing stable integrations of varied copy numbers of a BLM::eGFP fusion transgene. Throughout this figure, error bars indicate standard error of the mean (S.E.M.) for triplicate or quadruplicate technical reactions.
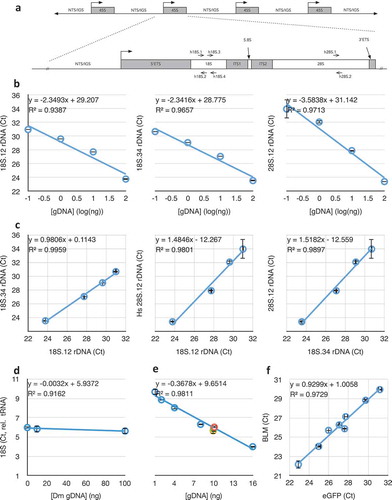
Figure 2. Variation in repeat DNA copy number in different individuals. (a) Variation in copy numbers of single-copy genes (BLM and SNA), three rDNA targets (18S, 28S, and 5S), telomeric repeats, and satellite-III, relative to tRNAMet. Blue data are from the laboratory standard DNA, and are by definition set to unity. Green, yellow, and red datasets are from three different individual ovaries obtained from the Univeristy of Arizona Tissue Acquisition and Cellular/Molecular Analysis Shared Resource without any identifying information. (b) Data obtained from three consecutive sections of one individual ovary. ‘Std gDNA’ is the laboratory standard human genomic DNA from peripheral blood. Throughout this figure, error bars indicate standard error of the mean (S.E.M.) for triplicate or quadruplicate technical reactions. S.E.M. from the laboratory standard is pooled into the data from the other individuals’ values.
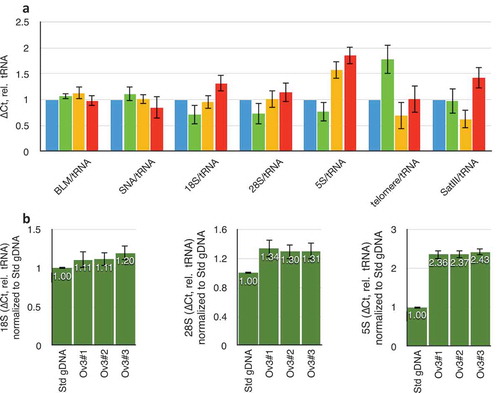
Table 2. Demographics of breast samples.
Figure 3. Comparisons of rDNA copy number changes in breast cancer tumours. (a) Correlation of 18S and 28S rDNA copy numbers is retained in both tumour (red) and non-tumour (blue) samples. (b) Data from (A) projected into one dimension to visualize the spread of individual data points. Black lines show the means. ‘nT’ = non-tumour, ‘T’ = tumour. The ordinal scale is shared with (a). (c) Plot of differences in 18S and in 5S rDNA copy numbers between tumour and non-tumour samples from the same individual. Black heavy lines highlight 0,0 origin, indicative of no change between 5S and/or 18S copy number between tumour and non-tumour; deviation from the origin is indicative of differences in one or both copy numbers. (d) As in (c), but comparing differences in 28S and 5S rDNA copy numbers. (e) Replotting of the absolute value of the data from 3C and 3D to highlight the discordance in the extent of changes to the 5S and 45S rDNA copy numbers. Throughout this figure, error bars indicate standard error of the mean (S.E.M.) for triplicate or quadruplicate technical reactions.
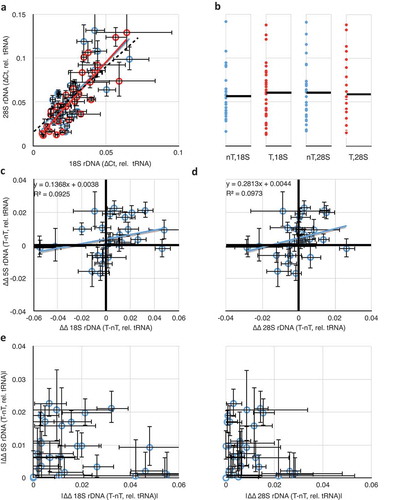
Figure 4. 18S and 5S rDNA copy number changes as a function of breast cancer genetic subtype. (a) Differences in 18S rDNA copy numbers between paired tumour and non-tumour samples as a function of categorical grouping of Estrogen Receptor Negative (ER-) and Positive (ER+), and Progesterone Receptor (PR). Data from . (b) As in (a), but with 5S rDNA. (c) As in (a), but categorically grouped by Her2 expression phenotype. Grades 0–1+ were called ‘negative’ and 2–3+ were called ‘positive.’ (d) as in (e), but with 5S rDNA. (e) Differences in 18S (blue) and 5S (green) rDNA copy numbers between paired tumour and non-tumour samples as a function of Ki-67 expression, R2 (18S) = 0.003, R2 (5S) = 0.001. Data and S.E.M. are from .
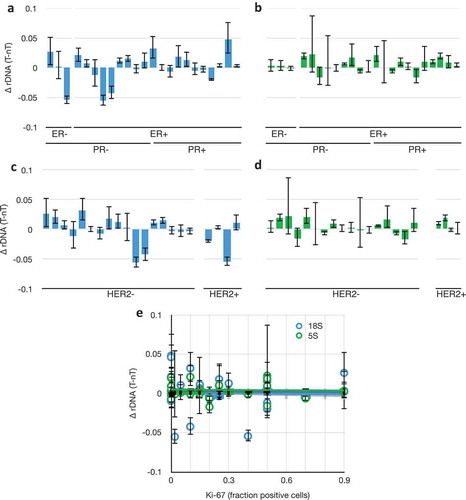
Figure 5. Comparison of telomere and satellite repeats in paired tumours and non-tumour tissues. (a) Very weak correlation between telomeric repeat copy number in tumours versus non-tumours from the same individuals. Mean copy numbers are indicated (mean for non-tumours, vertical blue line, is 0.007; mean for tumours, horizontal red line, is 0.008). X- and Y-axis values are per cent difference from the lab standard; dashed diagonal is no difference between tumour and non-tumour (y = x), and dotted diagonals demarcate a 2% difference (y = 1x ± 0.02). (b) No correlation between Satellite-III in tumours versus non-tumours from the same individuals. Throughout this figure, error bars indicate standard error of the mean (S.E.M.) for triplicate or quadruplicate technical reactions.
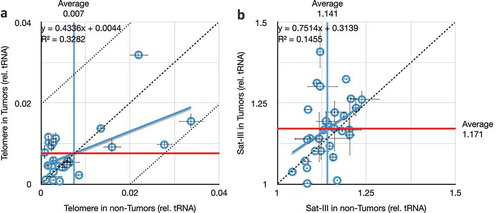
Figure 6. Comparisons of 18S rDNA and 5S rDNA in blood. (a) The correlation between 28S and 18S copy number is retained in blood samples taken from both women diagnosed with (red) or not diagnosed with breast cancer (blue). (b) The correlation between 5S and 18S rDNA copy numbers reported in [Citation27] is not found in our dataset (no diagnosis, blue, R2 = 0.03; positive diagnosis, red, R2 = 0.08). (a) and (b) share an ordinate, error bars are S.E.M., and data are copy numbers relative to tRNAMet. (c) Extremely weak correlation between 18S rDNA copy number and 5S copy number in whole blood taken from people with no indication of any cancer diagnosis. Data are presented without error bars and with censoring of the highest values for clarity, but all data are present in the inset graph. (d) Template dose response for the 5S rDNA primers, as in . (e) Comparison of 5S rDNA copy number determined by qPCR and Southern blot quantification.
![Figure 6. Comparisons of 18S rDNA and 5S rDNA in blood. (a) The correlation between 28S and 18S copy number is retained in blood samples taken from both women diagnosed with (red) or not diagnosed with breast cancer (blue). (b) The correlation between 5S and 18S rDNA copy numbers reported in [Citation27] is not found in our dataset (no diagnosis, blue, R2 = 0.03; positive diagnosis, red, R2 = 0.08). (a) and (b) share an ordinate, error bars are S.E.M., and data are copy numbers relative to tRNAMet. (c) Extremely weak correlation between 18S rDNA copy number and 5S copy number in whole blood taken from people with no indication of any cancer diagnosis. Data are presented without error bars and with censoring of the highest values for clarity, but all data are present in the inset graph. (d) Template dose response for the 5S rDNA primers, as in Figure 1B. (e) Comparison of 5S rDNA copy number determined by qPCR and Southern blot quantification.](/cms/asset/809bfedd-24ff-4da8-a142-c5e922d6e928/kepi_a_1649930_f0006_c.jpg)
Table 3. Demographics of blood samples.
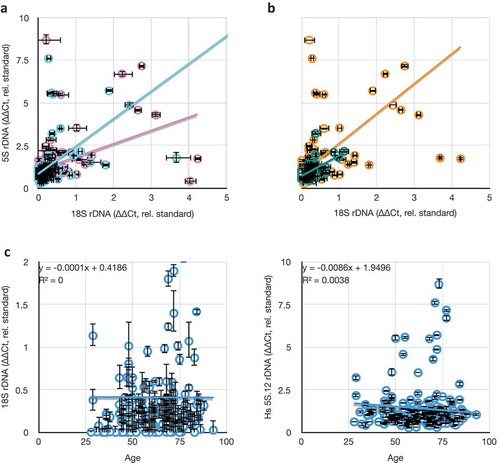
Figure 7. Comparisons between rDNA copy numbers and population variables. (a) Consistent lack of correlation between different rDNA cluster copy numbers (18S and 5S) in males (blue, y = 1.61x + 0.83, R2 = 0.24) and females (pink, y = 0.78x + 1.06, R2 = 0.19). (b) Consistent weak correlation between different rDNA cluster copy numbers (18S and 5S) in hispanic (green, y = 1.20x + 0.72, R2 = 0.37) and non-hispanic white (orange, y = 1.75x + 0.87, R2 = 0.30) individuals. (c) Consistent lack of correlation between 18S and 5S rDNA copy numbers as a function of age of blood donor. All values in this graph are represented as rDNA copy number relative to tRNAMet, and normalized to the lab standard.