
Figures & data
Table 1. DNMT1 primers.
Figure 1. (a). Schematic diagram of DNMT1 exons and protein domains of HCT116 and HCT116-Dnmt1∆3−5 cells. Exon configuration of WT DNMT1, with annotation of primer sites used for analysis of DNMT1∆3−5, and highlighted region of genomic deletion in this cell line. Protein domain schematic based on Pfam sites in Dnmt1 and Dnmt1∆3−5. (b). Analysis of genomic Dnmt1 status in HCT116-Dnmt1∆3−5 cells. Polymerase chain reaction analysis of Dnmt1 in HCT116-Dnmt1∆3−5 cells in comparison to the endogenous WT gene in HCT116 cells. mRNA was extracted from cells, converted to cDNA by reverse transcription and cDNA analysed by PCR using primers specific to DNMT1 exons 1 and 6 (). PCR products were then analysed by gel electrophoresis resulting in a reduced DNMT1 product size in HCT116-Dnmt1∆3−5 cells. (c). Western blot analysis of Dnmt1 and interaction partners in HCT116 and HCT116-Dnmt1∆3−5 cells. Fifteen micrograms of whole protein lysates from HCT116 and HCT116-Dnmt1∆3−5 cells were loaded onto a single phase 8% SDS gene and analysed by western blot analysis for protein expression of Dnmt1 (D59A4 antibody, see ), Usp7, and Beta-Catenin. Tubulin protein abundance was used as a loading control. N = 3. (d). Nuclear-enriched protein samples of HCT116 and HCT116-Dnmt1∆3−5 cells prepared for mass spectrometry analysis of their nuclear proteomic profile. Fifteen micrograms of nuclear-enriched protein lysates from HCT116 and HCT116-Dnmt1∆3−5 cells, three replicates of each, were loaded onto a single phase 8% SDS gene and analysed by western blot analysis for protein expression of Dnmt1 (D63A6 antibody, see ). Lamin A/C protein abundance was used as a loading control for the nuclear-enriched lysate. These samples were then taken forward and prepared for nuclear proteomic analysis by data independent mass spectrometry analysis.
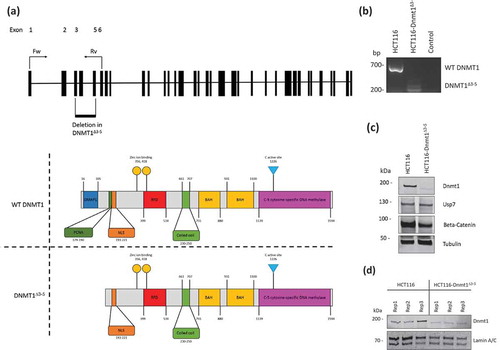
Figure 2. (a). Gene Ontology terms enriched in the proteome from HCT116-Dnmt1∆3−5 cells. Gene Ontology terms from the set of significantly (p < 0.05) differential increased proteins in hypomorph cells. Selected GO terms where p-value <0.05 and the rank difference between hypomorph and wild-type GO terms are shown. (b). Gene Ontology terms enriched in the proteome from HCT116-Dnmt1WT cells. Gene Ontology terms from the set of significantly (p < 0.05) differential increased proteins in wild-type cells. Selected GO terms where p-value <0.05 and the rank difference between wild-type and hypomorph GO terms are shown. (c). Network analysis of proteins with differential abundance in HCT116-Dnmt1∆3−5 cells. Selected differential protein interaction-networks are shown (Catenin-EMT network coloured according to mutant/wild-type abundance ratio). Nodes in grey indicate proteins not identified in the mass-spectrometry datasets but analysed by Western blot. Protein interaction networks were identified using Pathway Studio and String DB, using evidence-based directional interaction search settings. Networks were then extracted and manually pseudo-coloured to articulate differential abundance change in the nuclear proteomic profile of HCT116-Dnmt1∆3−5 cells.
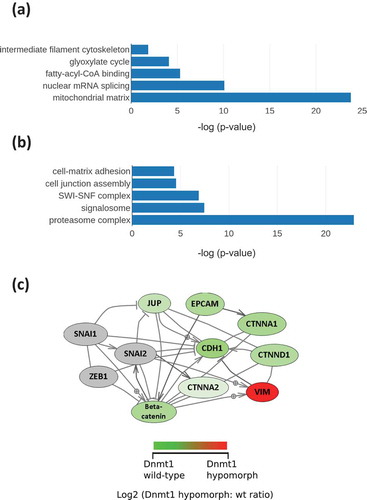
Figure 3. (a). Analysis of nuclear enriched and whole cell protein lysates for protein abundance of EMT markers. Fifteen micrograms of nuclear-enriched or whole cell protein lysates from HCT116 and HCT116-Dnmt1∆3−5 cells were loaded onto a single phase 8% SDS gene and analysed by western blot analysis for protein expression of Vimentin, N-Cadherin, and E-Cadherin. Tubulin protein abundance was used as a loading control for the whole cell protein lysate and Histone H3 protein abundance was used as a loading control for the nuclear-enriched lysate. N = 3. (b). Analysis of nuclear enriched and whole cell protein lysates for protein abundance of Delta-Catenin. Fifteen micrograms of nuclear-enriched or whole cell protein lysates from HCT116 and HCT116-Dnmt1∆3−5 cells were loaded onto a single phase 8% SDS gene and analysed by western blot analysis for protein expression of Delta-Catenin. ß-Actin protein abundance was used as a loading control for the whole cell protein lysate and Histone H3 protein abundance was used as a loading control for the nuclear-enriched lysate. N = 3. (c). Corresponding mass spectrometry protein quantification of Dnmt1 and key EMT protein markers. (d). Western blot analysis of transcription-factors associated with EMT. Fifteen micrograms of nuclear-enriched protein lysates from HCT116 and HCT116-Dnmt1∆3−5 cells were loaded onto a single phase 8% SDS gene and analysed by western blot analysis for protein abundance of Dnmt1 (D63A6 antibody, see ), Zeb1, Slug, Snail, and Twist. Lamin A protein abundance was used as a loading control. N = 3.
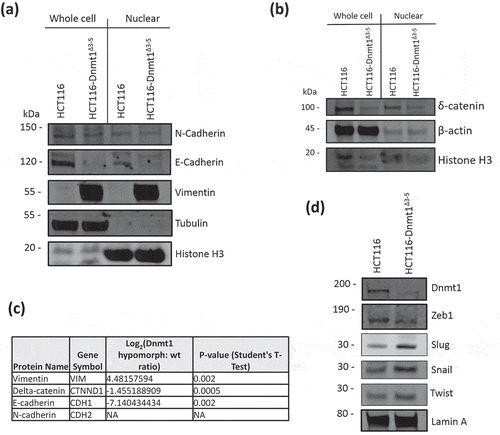
Figure 4. (a). Analysis of nuclear and cytosolic enriched protein lysates for Dnmt1 and Beta-Catenin localization. Fifteen micrograms of nuclear-enriched or cytosol-enriched protein lysates from HCT116 and HCT116-Dnmt1∆3−5 cells were loaded onto a single phase 8% SDS gene and analysed by western blot analysis for protein expression of Dnmt1 (D63A6 antibody, see ) and Beta-Catenin. Lamin B1 protein abundance was used as a loading control for the nuclear-enriched lysate. N = 3. (b). Immunofluorescence analysis of Beta-Catenin and Dnmt1 localization in HCT116 and HCT116-Dnmt1∆3−5 cells. Localization of Dnmt1 and Beta-Catenin protein was assessed using fluorophore-conjugated secondary antibodies and DAPI fixing agent. Channels are presented separately in addition to merged. Co-localization of Dnmt1 and Beta-Catenin was analysed using FIJI and MBF plugin, result of which is displayed in the ‘co-localization’ panel where areas of co-localization of Dnmt1 (red) and Beta-catenin (green) are highlighted in white.
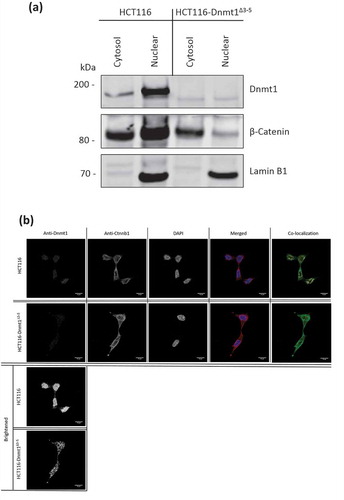
Figure 5. (a). Dnmt1 shRNA knockdown analysis on Vimentin protein abundance. Fifteen micrograms of whole cell protein lysates from shRNA knockdown HCT116 cells, HCT116-GFP controls cells and HCT116-Dnmt1∆3−5 cells were loaded onto a single phase 8% SDS gene and analysed by western blot analysis for protein expression of Dnmt1 (D63A6 antibody, see ) and Vimentin. A-Tubulin and Lamin A/C protein abundance were used as a loading control. N = 3. (b). Dnmt1 shRNA knockdown analysis on E-Cadherin protein abundance. Fifteen micrograms of whole cell protein lysates from shRNA knockdown HCT116 cells, HCT116-GFP controls cells and HCT116-Dnmt1∆3−5 cells were loaded onto a single phase 8% SDS gene and analysed by western blot analysis for protein expression of Dnmt1 (D63A6 antibody, see ) and E-Cadherin. A-Tubulin protein abundance was used as a loading control. N = 3. (c). Dnmt1 shRNA knockdown analysis on N-Cadherin protein abundance. Fifteen micrograms of whole cell protein lysates from shRNA knockdown HCT116 cells, HCT116-GFP controls cells and HCT116-Dnmt1∆3−5 cells were loaded onto a single phase 8% SDS gene and analysed by western blot analysis for protein expression of Dnmt1 (D63A6 antibody, see ) and N-Cadherin. A-Tubulin protein abundance was used as a loading control. N = 3. (d). The effect of wild-type Dnmt1 protein expression rescue in HCT116-Dnmt1∆3−5 cells on Vimentin protein abundance. Fifteen micrograms of whole cell protein lysates from HCT116 cells, HCT116-Dnmt1∆3−5 cells, and HCT116-Dnmt1∆3−5 cells transfected with either a full-length WT Dnmt1 expression vector or an empty control were loaded onto a single phase 8% SDS gene and analysed by western blot analysis for protein expression of Dnmt1 (D63A6 antibody, see ). Tubulin protein abundance was used as a loading control. N = 2.
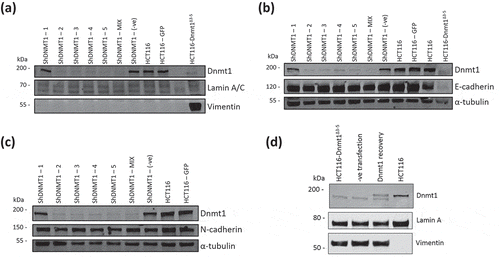
Table 2. Primary antibodies used in this study.
Table 3. shRNA containing vectors used to knockdown DNMT1 expression Dnmt1 protein expression (derived from GenBank Accession: NM_001379).