
Figures & data
Table 1. Participant demographics.
Figure 1. Epigenome-wide association study results for placental copper status.
Volcano plots display the p-value and effect estimate (log fold change) for the a. RICHS, b. the NHBCS cohort-level associations, as well as for c. the meta-analysis. d. The Manhattan plot of meta-analysis results indicates -log10(p-value) for individual CpG associations with placental copper status, as well as locations on the chromosomes (indicated on x-axis). Red vertical lines indicate differentially methylated regions found by CombP. Blue dots represent CpGs within the DMR.
Figure 2. Distribution of results among genomic compartments.
a. Proportion of CpG sites in CpG islands (CGI), CGI shores and CGI shelves. Open sea CpGs are not near any CGI feature. b. Proportion of CpG sites within ChromHMM states. For both figures, compartment distributions are shown for all CpGs on the 450k array, all significant CpG sites (Sig), positively associated CpG sites (Pos), or negatively associated CpG sites (Neg). TSS and Enh are abbreviations of transcription start site and enhancer, respectively.
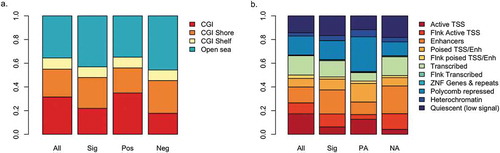
Table 2. Copper-associated differentially methylated regions.
Figure 3. Copper-associated DMR at ZNF197.
Mean methylation proportion for CpGs within the ZNF197 DMR, between high and low placental copper groups, indicates that higher copper results in higher methylation across the DMR in a. NHBCS and c. RICHS. b. DMR location relative to the ZNF197 start site, and chromatin information for foetal placenta from the ROADMAP epigenomics project [Citation26] (DNaseI hypersensitivity region, RNA-seq signal and ChromHMM annotation) and the UCSC genome browser [Citation27] (CpG island) are also displayed.
![Figure 3. Copper-associated DMR at ZNF197.Mean methylation proportion for CpGs within the ZNF197 DMR, between high and low placental copper groups, indicates that higher copper results in higher methylation across the DMR in a. NHBCS and c. RICHS. b. DMR location relative to the ZNF197 start site, and chromatin information for foetal placenta from the ROADMAP epigenomics project [Citation26] (DNaseI hypersensitivity region, RNA-seq signal and ChromHMM annotation) and the UCSC genome browser [Citation27] (CpG island) are also displayed.](/cms/asset/99785bf2-4830-455d-9865-2b3fd29d07da/kepi_a_1661211_f0003_c.jpg)
Figure 4. ZNF197 Genome-Wide Co-expression.
Volcano plots display the p-value and effect estimate (log fold change). One hundred and thirty-eight genes are significantly co-expressed with ZNF197 (larger points in the volcano plot). Large grey dots indicate that the association had a false discovery rate (by Benjamini Hochberg method) less than 0.05 and the large black dots indicate a Bonferroni-adjusted p-value less than 0.05.
Table 3. Super-list of genes co-expressed with and containing a binding motif for ZNF197.