
Figures & data
Figure 1. (a) XRD pattern for the rGO; intensity is expressed in arbitrary units (a.u.). (b) Representative SEM images (upper panels) and TEM images (lower panels) of the rGO. (c) High-resolution XPS spectra; intensity is expressed in arbitrary units (a.u.), binding energy (B.E.) is measured in electronvolts (eV). (d) Nitrogen adsorption/desorption isotherm of rGO; P/P0 is the relative pressure.
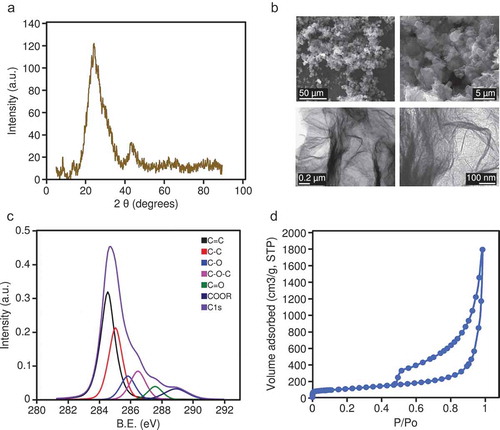
Figure 2. (a) Density plot showing DNA methylation β-values from all of the CpG sites analysed by the Illumina MethylationEPIC platform in the BEAS-2B control cells. Highlighted from the density plot are two treemap plots indicating the semantic summaries of gene ontologies found for those genes containing either low- or high-methylation CpG sites. (b) Violin plots indicating the DNA methylation β-value distribution of CpGs mapped to CpG Island-related regions (upper panel) or gene-related regions (lower panel). The median values of the distributions are highlighted by a black dot. (N_Shelf: north shelf, N_Shore: north shore, Island: CpG Island, S_Shelf: south shelf, S_Shore: south shore; TSS1500, TSS200: 1500 or 200 bp from transcription start site, nogene: intergenic).
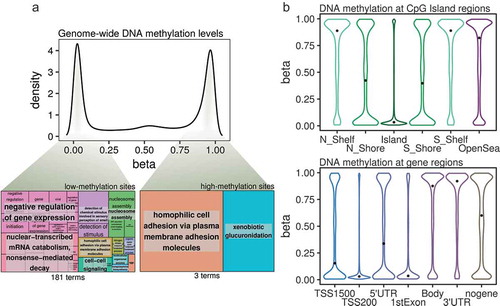
Figure 3. (a) Experimental set-up of the rGO exposure experiments and collapsing of the replicates. (b) Left panel: heatmap depicting Spearman correlation values for the correlation between the profiled β-values of the CpG sites of the different collapsed experimental conditions. Right panel: density scatter plot showing an example of the correlation between the β-values of the CpG sites of the rGO 15-day 1 μg/mL condition and the 15-day control condition. The colour indicates the density of the points, from low (blue) to high (yellow).
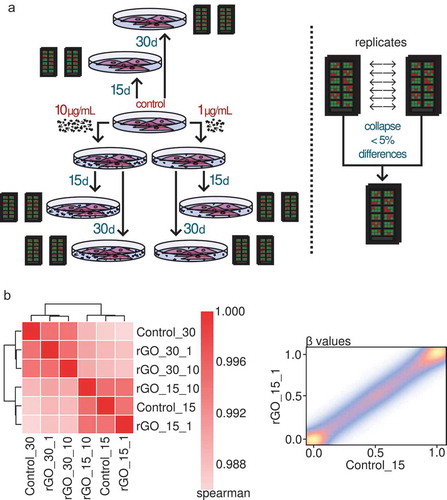
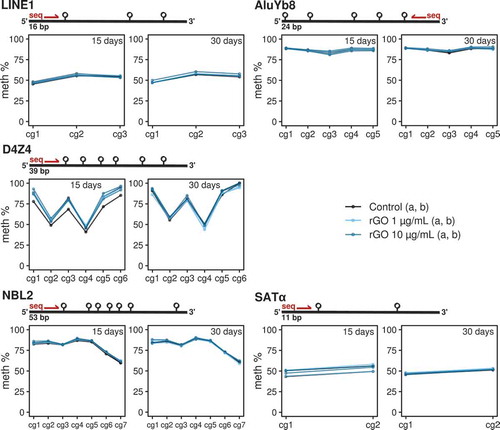
Figure 4. Line/point plots describing the DNA methylation values of different repeat elements measured by bisulphite pyrosequencing. For each experimental condition, the 2 technical replicates (‘a’ and ‘b’) are plotted as independent lines. For each DNA repeat region, a different number of CpGs were analysed. Values for the 15-day treatments at 0, 1 and 10 μg/mL concentrations and 30-day treatments at 0, 1 and 10 μg/mL concentrations are separated in 2 different plots.
Supplemental Material
Download MS Word (12.2 KB)Supplemental Material
Download Zip (1.8 MB)Availability of data and materials
The raw IDAT and preprocessed data generated in this study by Illumina Infinium MethylationEPIC BeadChip technology are available in the ArrayExpress public repository under accession E-MTAB-7719.