
Figures & data
Table 1. Characteristics of the Anniston Community Health Survey, phases I and II.
Table 2. PCBs measured in ACHS-I and ACHS-II.
Figure 1. Overview of data analyses strategy. Robust linear regression models were adjusted for age, race, sex, smoking status, total serum lipids, and percentages for six different white blood cell types. Seven different PCBs groupings were used in regression: 1) Σ35PCBs, 2) mono-ortho substituted PCBs, 3) di-ortho substituted PCBs, 4) tri/tetra-ortho substituted PCBs, 5) oestrogenic PCBs group 1, 6) oestrogenic PCBs group 2, 7) antiestrogenic PCBs. Stratified and DMR analyses were not conducted in ACHS-II.
Figure 2. Sum of 35 PCB levels by age group and race for ACHS-I (n = 518) and ACHS-II (n = 299) participants. PCB values are graphed on a log10 scale. Box/violin plot labels are non-transformed mean PCB level (ng/g wet-weight). (a) ACHS-I age group distribution. (b) ACHS-I race distribution. (c) ACHS-II age group distribution. (d) ACHS-I race distribution. Wilcoxon rank-sum test p-values are presented.
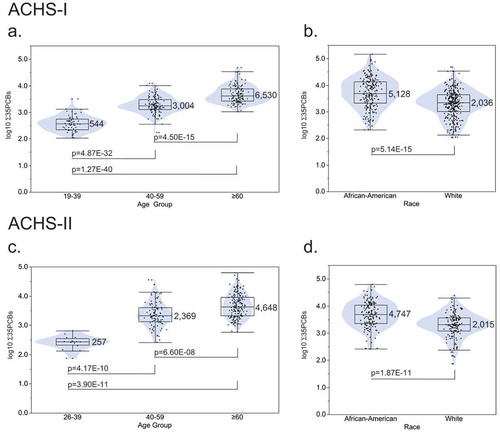
Table 3. Top ACHS-I PCB-associated CpGs, selected by Bonferroni (BF) threshold p ≤ 6.70E-08.
Figure 3. Venn diagram of 280 significantly differentially methylated CpGs (BH FDR p ≤ 5.00E-02) in ACHS-I for four PCB groups: sum of 35 PCBs, mono-ortho substituted PCBs, di-ortho substituted PCBs, and tri/tetra-ortho substituted PCBs. Robust linear regression models were adjusted for age, race, sex, smoking status, total serum lipids, bisulphite-conversion batch, and estimated percentages of CD4+ and CD8 + T-cells, CD19 + B-cells, monocytes, granulocytes, and natural killer cells.
Figure 4. PRSS23 genome browser view.
a. Tracks defined from top:Roadmap Epigenome Project Whole Genome Bisulphite Sequencing shows methylation level of each CpG in region.Refseq genes display three mRNA isoforms.CpG island is marked in green.Roadmap Chromatin HMM model for 6 cell types indicates only Natural Killer cells express PRSS23 in blood.ChromHMM code: Red = open chromatin; yellow = active enhancer; Green = active transcription; purple = poised promoter; grey = repressed, closed chromatin.NK Cell H3K27ac ChIP-seqENCODE Transcription Factor ChIP-seqb. Cg004755490 indicated in enhancer region defined by H3K27ac and H3K4me1 histone ChIP-seq in NK cells as determined by Roadmap project. ENCODE transcription factor ChIP-seq for small MAF proteins (binding partners of NRF2).c. Small MAF/NRF2 binding motif located within ChIP-seq peak.
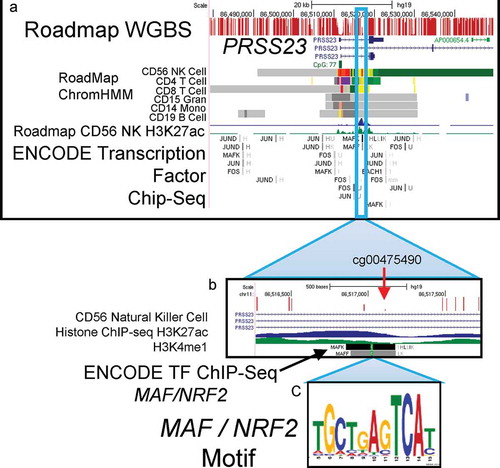
Figure 5. PCB quartile distributions for CpGs with ≥ 1.0% absolute differential methylation. Kruskal-Wallis test and Wilcoxon rank-sum test p-values are presented.
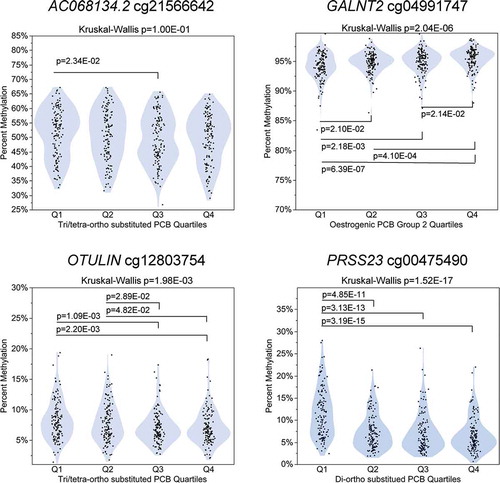
Table 4. ACHS-I DMRs selected by FDR p ≤ 5.00E-02 and absolute differential methylation ≥ 1.00%.