Figures & data
Figure 1. Double knockdown of Hdac1 and 2 results in embryonic lethality during the morula to blastocyst transition. (a) Schematic overview of two approaches (I: RNAi; II: small-molecule inhibitor, FK228) used to investigate in vivo roles of Hdac1 and 2 during preimplantation development. (b) qPCR analysis of knockdown efficiency of siRNA cocktails targeting Hdac1 and 2 from 8-cell to blastocyst stage. Mouse zygotes derived in vivo were microinjected with Hdac1/2 siRNA cocktails (20 µM, 10 pl, cKD) or negative control siRNAs (NC). Embryos were collected at 8-cell (8c), morula (M), and blastocyst (Bl) stage (n = 3 pools of 5–10 embryos each per treatment). Data were stated as mean ± SEM normalized to endogenous control (H2afz; *P < 0.05). (c) Immunoblot analysis of Hdac1 and 2 in NC and cKD morulae (30 embryos per group, 2 replicates were performed with similar results). β-actin (Actb) was used as a loading control. (d) Immunocytochemical detection of dramatic reduction of Hdac1 and 2 protein in cKD blastocysts. Three replicates were conducted and at least 10 embryos analysed in each group (Scale bar: 25 µm). (e) Representative photos of NC, Hdac1 KD, Hdac2 KD, and cKD embryos from Day 3 after mating (D3) to D5. Arrow head: ICM outgrowth; Arrow: trophoblast giant cell. Asterisk: Degenerated embryos. (f) Blastocyst rate in NC and cKD groups at D4 (n = 5; 16–33 embryos per group per replicate). Data are shown as mean ± SEM (*P < 0.05). (g) Cell counting analysis of NC and cKD embryos from D2.5 to D4 (n = 3). (H) Per cent live offspring out of embryos transferred (n = 3; 15–20 embryos were transferred per group). (i and j) Rescue of cKD embryos by microinjection of exogenous Hdac1 and/or Hdac2 mRNA (n = 3; 15–20 embryos per group; *P < 0.05). (k) Blastocyst rate and total cell number per embryo in embryos treated with Hdac1/2-specific inhibitor, FK228 (n = 3; 15–20 embryos per group). Data are expressed as mean ± SEM. Different superscripts indicate significant differences (P < 0.05).
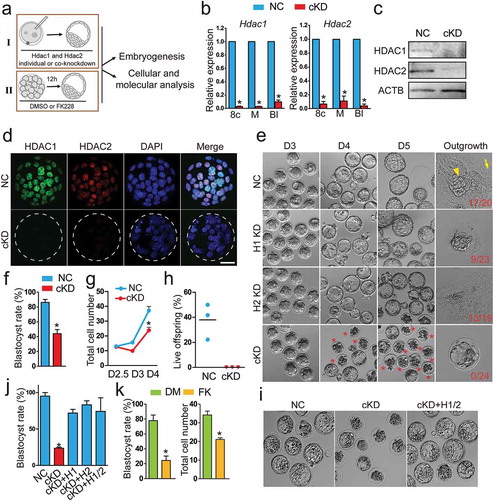
Figure 2. RNA-seq analysis of embryos deficient of Hdac1 and 2. (a) Schematic overview of the samples collected for RNA-seq analysis (n = 3; 60 embryos/group/replicate). (b) Validation of RNA-seq results on expression levels of selected genes (Downregulated:Myc, Dab2, Amot, Cdh1, Fgfr2, Otx2; Upregulated: Arid3a, Sfmbt2; No change: Tet1, Ctnnb1). Three biological replicates were performed with 5–10 morula collected for each group (*P < 0.05). (c) GO analysis of downregulated genes in cKD morulae. The data indicate enriched GO terms related to epigenetic regulation, cell proliferation, and apoptosis. (d) KEGG analysis of differentially expressed genes (DEGs) between NC and cKD morulae. The data indicate cKD leads to abnormal signalling pathway of pluripotency network, P53 and Hippo. (e) Overrepresentation of genes related to lineage specification, cell cycle, and epigenetic regulation among DEGs.
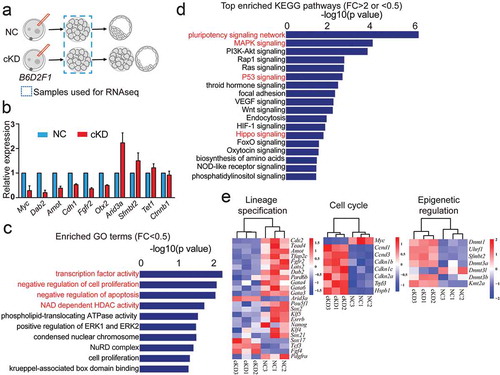
Figure 3. Hdac1 and 2 deficiency leads to increased incidence of apoptosis, increased TRP53 acetylation, and cell proliferation arrest. (a) TUNEL analysis of NC (n = 10) and cKD blastocysts (n = 10). The data revealed a dramatic increase of incidence of apoptosis in cKD blastocysts. Three biological replicates were conducted. (b) Immunocytochemical analysis of TRP53 acetylated on K379 (P53ac) in blastocysts. The intensity of P53ac was improved significantly (n = 3; 5–10 embryos per group per replicate, Scale bar: 25 μm). Nuclear was counterstained with DAPI. (c) Hdac1 was mutated at the deacetylase site and mRNA was in vitro produced. Wildtype Hdac1 (H1 WT) and mutant Hdac1 (H1 MT) was introduced into wild-type zygotes and 2-cell embryos were collected for immunocytochemical analysis (n = 3; 5–10 embryos per group per replicate, Scale bar: 25 μm). (d) The intensity of P53ac was not changed in H1 WT embryos but increased in H1 MT embryos (*P < 0.05). (e) Immunocytochemical examination of histone H3 serine 10 phosphorylation (pH3S10), a marker for late G2 and mitosis, in blastocysts (n = 3; 5–10 embryos per group per replicate; Asterisk: pH3S10 positive blastomere; Scale bar: 25 μm).
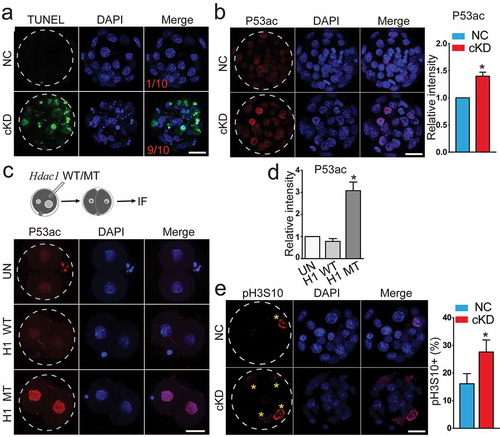
Figure 4. CDX2 was inactivated in embryos deficient of Hdac1 and 2. (a) qPCR analysis of Cdx2 in 8-cell embryos, morula and blastocysts (n = 3 pools of 5–10 embryos each per group). (b–e) Immunocytochemical analysis of CDX2 in morula and blastocysts after RNAi (b and c) or FK228 treatment (d and e). Three biological replicates with 5–10 embryos analysed per group each time. The intensity of CDX2 was diminished in cKD and FK228 treated, but not H1 or H2 KD embryos (c and e). E-Cad: E-Cadherin; DM: DMSO; FK: FK228. (f and g) Rescue of CDX2 in cKD embryos after injection of exogenous Hdac1 or 2. The experiment was conducted three times and 5–10 embryos analysed per group per time. Yellow dashed oval: inner cell mass. (h) Non-specific siRNAs or siRNAs cocktail targeting Hdac1 and 2 were microinjected into one blastomere at 2-cell stage. H2B-RFP mRNA was co-injected as a tracking marker. Blastocysts were collected for immunocytochemical analysis (n = 3; 5–10 embryos per group per replicate). The intensity of CDX2 was diminished not only in cells derived from the siRNA-injected blastomere but those from noninjected blastomere in cKD groups. For panels B, F, and H, single confocal sections are shown for individual staining figures and maximum projections are shown for merge figures.
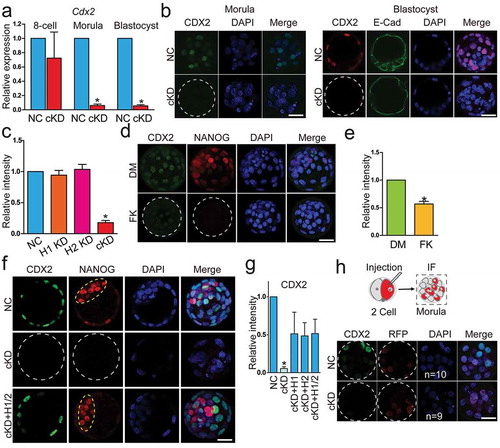
Figure 5. Key pluripotency genes OCT4, NANOG,and Sox2 were downregulated in embryos deficient of Hdac1 and 2. (a) qPCR analysis of Oct4, Nanog, and Sox2 in NC and cKD embryos (n = 3 pools of 5–10 embryos each per group). (b and c) Immunocytochemical analysis of OCT4 and NANOG in blastocysts after RNAi. The intensity of NANOG, but not OCT4, was diminished in cKD embryos (panel C; n = 3; 5–10 embryos were analysed per group each time, *P < 0.05). Yellow dashed oval: inner cell mass. (d) Rescue of NANOG in cKD embryos after injection of exogenous Hdac1 and/or 2. The experiment was conducted three times and 5–10 embryos analysed per group per time. (e) Analysis of the intensity of NANOG in embryos treated with either DMSO (DM, vehicle control) or FK228 (FK).
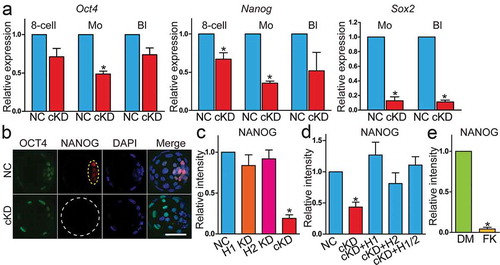
Figure 6. Hda1 and 2 co-knockdown results in aberrant Hippo signalling pathway. (a) qPCR analysis of Tead4 and Yap1 in 8-cell embryos (8c), morula (M), and blastocysts (Bl) (n = 3 pools of 5–10 embryos each per group). (b–d) Immunocytochemical (n = 3; 6–10 embryos were analysed per group each time, *P < 0.05) and immunoblot analysis (n = 2 pools of 30 embryos each per group, similar effects were obtained) of Tead4 in morula after RNAi. Both per cent Tead4 positive cells (panel C) and the intensity of Tead4 (panel D) were reduced in cKD. (e and f) Immunocytochemical analysis of Yap in morula (n = 3; 5–10 embryos were analysed per group each time). Asterisk: nuclear Yap.
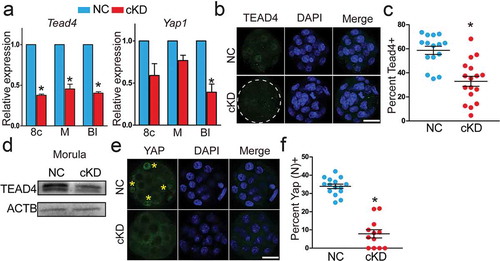
Figure 7. Increased global DNA methylation with upregulated DNA methyltransferases in embryos deficient of Hdac1 and 2. (a) Immunocytochemical analysis of 5’ methylcytosine (5mc) and 5 hydroxmethylcytosine (5hmc) in blastocysts. The intensity of 5mc and 5hmc was increased in cKD embryos (C and E) (n = 3; 5–10 embryos were analysed per group each time, *P < 0.05). (b–c) Hdac1 and 2 deficiency results in increased intensity of Uhrf1, Dnmt3a, and Dnmt3b. The experiment was conducted three times and 8–10 embryos analysed per group (*P < 0.05; Scale bar: 25 µm).
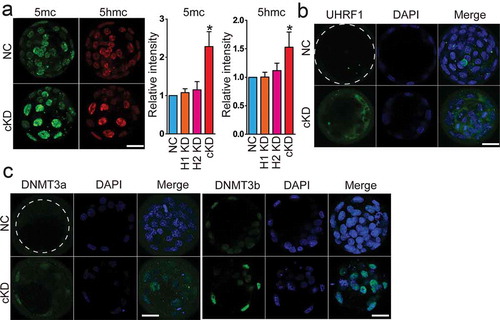
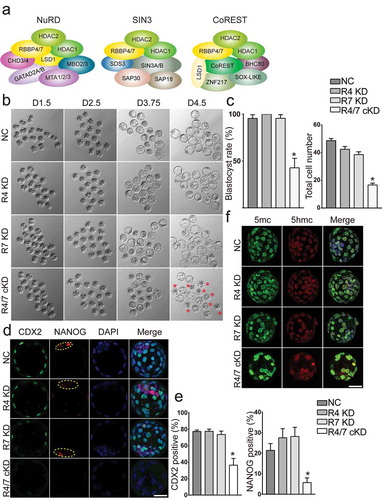
Figure 8. Rbbp4 and 7 deficiency leads to similar phenotypes as in Hdac1/2 cKD embryos. (a) Hdac1, Hdac2, Rbbp4, and Rbbp7 are core components in several epigenetic complexes: NuRD, Sin3, and CoREST. (b) Developmental potential of embryos lacking Rbbp4 and/or Rbbp7. Three replicates were conducted with 15–20 embryos analysed per group per replicate. (c) Blastocyst rate and cell counting analysis of the experiment in panel B. (d) Both CDX2 and NANOG were diminished in Rbbp4 and 7 cKD embryos. (e) CDX2 or NANOG positive blastomeres were reduced in Rbbp4 and 7 cKD embryos. (f) Immunostaining analysis of 5mc and 5hmc.