Figures & data
Figure 1. (a&b) Scatter plots of DNA promoter methylation of PTPRT (the cg03403065 probe) and mRNA expression in TCGA squamous cell carcinoma and adenocarcinoma. Tumour samples are black dots, and normal samples are green triangles. The plots demonstrated loss of expression in methylated tumours. Boxplots of DNA promoter methylation of PTPRT in the same samples showed promoter hypermethylation of tumour samples. (c) Boxplots of DNA promoter methylation of PTPRT by PTPRT mutation types. Most of PTPRT hypermethylated samples are PTPRT wild type (WT). Only a small subset of the missense mutated samples showed hypermethylation suggesting that these mutations could be non-functional passenger mutations. (d) Scatter plots of DNA promoter methylation of PTPRT (cg13168820 probe) and mRNA expression in the Pittsburgh Lung Cancer Cohort. As for TCGA, there was a trend for loss of expression in methylated tumours.
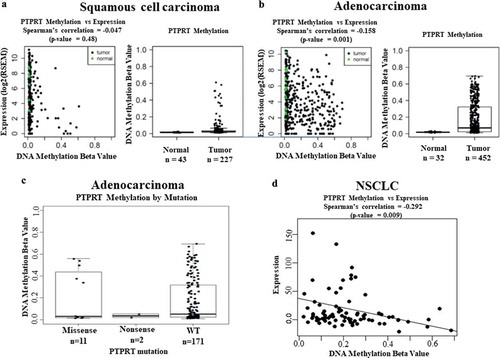
Figure 2. (a) Methylation of PTPRT promoter region in NSCLC tumours. NSCLC tumours samples from Stage 1A/1B patients were processed to extract DNA followed by bisulphite conversion to determine PTPRT promoter methylation by Real Time PCR. Out of the 12 tumour samples, six tumours had detectable promoter region methylation (Patient #s 2, 4, 6, 8, 9 and 11) whereas the remaining 6 tumours demonstrated very low methylation of the PTPRT promoter region (Patient #s 1, 3, 5, 7, 10 and 12), which compared well with the methylated beta values. (b&c) Association of PTPRT promoter methylation to STAT3 target gene expression in lung tumours. Lung tumours (Patient #s 1, 2 and 3) were assessed for STAT3 target gene expression by RT-PCR. Cyclin D1 (Figure 2(b)) and Bcl-XL (Figure 2(c)) mRNA expression was found to associate with PTPRT methylation status. (d&e) Association of PTPRT promoter methylation and Bcl-XL and Cyclin D1 mRNA expression. Scatter plots of DNA promoter methylation of PTPRT and Bcl-XL and Cyclin D1 mRNA expression in TCGA adenocarcinoma showed an increase in Bcl-XL (Figure 2(d)) and Cyclin D1 (Figure 2(e)) mRNA expression with increase in PTPRT methylation.
Figure 3. (a) PTPRT mRNA expression associates with PTPRT methylation status in lung cancer cell lines as demonstrated by RT-PCR. Downregulation of PTPRT mRNA expression was observed in lung cancer cell lines, A549, H23, H1650, H1435, H1793 and H1703 which demonstrated hypermethylation in PTPRT promoter region whereas the cell line, H520 showed increased PTPRT mRNA expression that associated with unmethylation of the PTPRT promoter region. This experiment was repeated twice with similar results. In this Figure, M = Methylation and U = Unmethylation of the PTPRT gene in the cell lines tested. (b) PTPRT promoter methylation status associates with pSTAT3Tyr705 expression in NSCLC cell lines. Lung cancer cell lines tested for pSTAT3Tyr705 levels demonstrated that methylation of the PTPRT promoter region strongly associated with pSTAT3Tyr705 expression levels as demonstrated by western analyses. Out of the seven lung cancer cell lines, A549, H23, H1650, H1435, H1793 and H1703 which showed PTPRT promoter methylation also showed expression of pSTAT3Tyr705 whereas the expression of pSTAT3Tyr705 was almost negligible in the cell line H520 which associated with the unmethylation status of PTPRT, as demonstrated in our study. This experiment was repeated twice with similar results.
Figure 4. (a) Knockdown of PTPRT mRNA expression in H520 cells by PTPRT siRNA. PTPRT knockdown by siRNA in H520 cells which demonstrated PTPRT mRNA expression in our study resulted in decreased expression of PTPRT mRNA. H520 cells were treated with PTPRT siRNA in presence of OPTI-MEM and after 48h, cells were replaced with complete media and at the end of 72h, RNA was extracted. RT-PCR data showed that H520 cells transfected with PTPRT siRNA had significantly lower 48% (p < 0.05) PTPRT mRNA expression compared to cells treated with vehicle. PRPRT mRNA expression in H520 cells transfected with scrambled siRNA did not show any significant decrease when compared to cells treated with vehicle. Results are from three triplicate wells in one experiment. (b & c) Increased expression of Cyclin D1 and Bcl-XL upon PTPRT knockdown in H520 cells. H520 cells which demonstrated unmethylation of the PTPRT promoter region were transfected with PTPRT siRNA. After 72h, the cells showed increased mRNA expression of the STAT3 target genes such as Cyclin D1 and Bcl-XL compared to the cells treated with vehicle or scrambled siRNA as determined by RT-PCR. Results are from three triplicate wells in one experiment. (d & e) Increased pSTAT3Tyr705 along with STAT3 target gene expression upon PTPRT knockdown by siRNA. H520 cells transfected with PTPRT siRNA caused increased pSTAT3Tyr705 along with Cyclin D1 and Bcl-XL protein expression compared to the cells treated with vehicle or scrambled siRNA at the end of 72h and 96h as determined by western analyses. The results are from triplicate wells from one experiment.
Figure 5. (a, b, c & d) Increased PTPRT promoter methylation is associated with increased sensitivity to STAT3 inhibition. Lung cancer cell lines which are methylated (H23 and H1703) or unmethylated (H520) in the PTPRT promoter region were treated with increasing concentrations of the three STAT3 inhibitors SID 864,669, SID 4,248,543 and UPCDC 10,205 in complete media. At the end of 72h, MTT assay was done to determine % kill which increased with increasing concentrations of SID 864,669 (Figure 5(a)), SID 4,248,543 (Figure 5(b)) and UPCDC 10,205 (Figure 5(c)) and was more pronounced in H23 and H1703 which are methylated in the PTPRT promoter region in conjunction with high pSTAT3Tyr705 expression. The inactive compound UPCDC 10,381 did not have an effect in any cell lines tested (Figure 5(d)). Results are from four separate experiments. (e, f & g) Increased PTPRT promoter methylation was accompanied with increased sensitivity to STAT3 inhibition as evident from the reduction of STAT3 target gene expression. H23, H1703 and H520 cells were treated with varying concentrations of SID 864,669 and at the end of 24h, cells were harvested for RNA extraction and RT-PCR was performed to determine the mRNA expression of the STAT3 target genes. The STAT3 inhibitor SID 864,669 caused a reduction in Cyclin D1 and Bcl-XL mRNA expression in H23 (Figure 5(e), * indicates p < 0.05) and H1703 (Figure 5(f), * indicates p < 0.05) cells which showed PTPRT promoter methylation with concomitant expression of pSTAT3Tyr705. In H520 cells, there was no effect of SID 864,669 on the mRNA expression of STAT3 target genes (Figure 5(g)).