Figures & data
Figure 1. Overview of the MBD-seq workflow.
Step 1) Genomic DNA is randomly fragmented with ultrasonication. Step 2) Methylated fragments are captured by a protein with high affinity for double-stranded DNA harbouring methylated CpGs. Unmethylated DNA fragments are washed away. Step 3) The captured portion of the methylome is eluted. Step 4) The methylation enriched fraction (the elute) is used to generate barcoded sequencing libraries. Step 5) Barcoded libraries are pooled in equal molarities. 6) The library pool is sequenced and aligned to the reference genome. Step 7) The aligned reads are analysed with suitable software such as RaMWAS that was specifically developed for large-scale methyome-wide association studies.
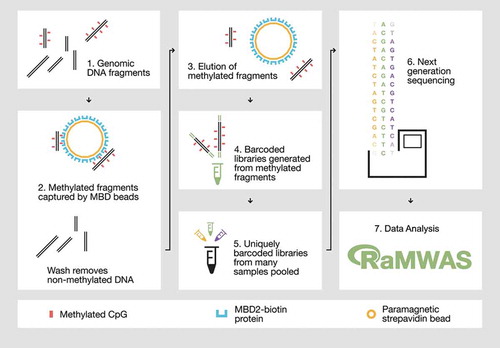
Figure 2. Correlation between nearby located CpGs.
Using WGB-seq data [Citation2] the estimated correlation (y-axis) is plotted against the distance (bp) between CpGs. The typical resolution range (150 bp) of MBD-seq is indicated by the horizontal bar at the top of the graph. The pairwise correlation between neighbouring CpG with lag 10 (the correlation between CpG 1 and CpG 11; CpG 2 and CpG 12 etc.) and lag 1 (the correlation between CpG 1 and CpG 2; CpG 2 and CpG 3 etc.) is represented by a dashed and a solid line, respectively.
![Figure 2. Correlation between nearby located CpGs.Using WGB-seq data [Citation2] the estimated correlation (y-axis) is plotted against the distance (bp) between CpGs. The typical resolution range (150 bp) of MBD-seq is indicated by the horizontal bar at the top of the graph. The pairwise correlation between neighbouring CpG with lag 10 (the correlation between CpG 1 and CpG 11; CpG 2 and CpG 12 etc.) and lag 1 (the correlation between CpG 1 and CpG 2; CpG 2 and CpG 3 etc.) is represented by a dashed and a solid line, respectively.](/cms/asset/2cd98d71-28c0-409b-8874-98bcad311085/kepi_a_1695339_f0002_oc.jpg)
Figure 3. MBD-seq and WGB-seq provide comparable methylome profiles.
Difference (Δ) in methylation between neurons and glia along chromosome 17. Methylation was assayed in sorted neurons and glia from a human brain sample by WGB-seq, MBD-seq, and MeDIP-seq. Positive values indicate higher methylation in neurons. (a) Chromosome-wide trace of neuron-glia differences in methylation along chr17. To facilitate visualization the 10 kb simple moving average of Δ methylation is plotted. Highlighted region indicates the location of the enlarged region displayed in the lower pane. (b) Enlarged region along chr17:77,090,000–77,096,500 (hg19) displaying focal Δ methylation between neurons-glia. Highlighted region indicates the location of cell-type-specific differential methylation that is detected in WGB-seq and MBD-seq, but not MeDIP-seq. Locations of Infinium HumanMethylation 450K sites are also shown for illustration.
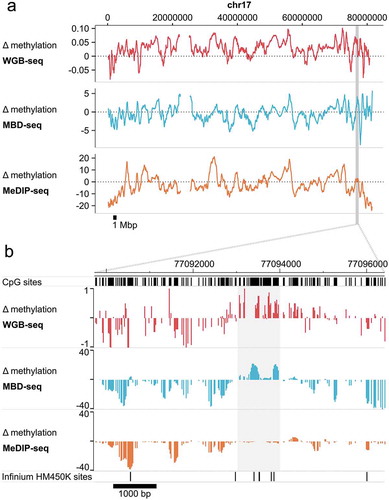
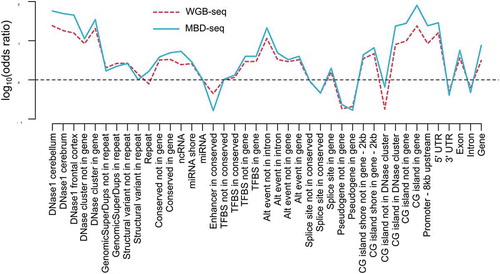
Figure 4. Genomic enrichment profiles across biological features are comparable for MBD-seq and WGB-seq.
Methylation profiles across genomic features. The red line represents WGB-seq and the blue line MBD-seq enrichment profiles. The x-axis show the genomic feature tested and the y-axis the log10 of the odds ratio calculated from the 2 by 2 tables where loci were classified as methylated versus non-methylated and genomic features as present versus absent.