Figures & data
Figure 1. DNA methylation dynamics in medaka PGCs. (a): Global CpG methylation levels observed in PGCs at different stages of life history; (b): Beanplots showing the distribution of CpG methylation levels of the pooled replicates of medaka blastula and PGCs. Methylation was quantitated by taking 5 kb genomic probes approach; (c): Distribution of CpG methylation levels across the genome; (d): Average CpG methylation of the genomic features in PGCs at different stages of life history; (e): Average CpG methylation profiles over all medaka annotated genes starting from 5 kb upstream (−5 kb) of the transcription start site (TSS), through scaled gene bodies to 5 kb downstream (+5 kb) of transcription end sites (TESs); (f): Average CpG methylation profiles over all medaka CpG islands, CGI shores, and CGI shelves.
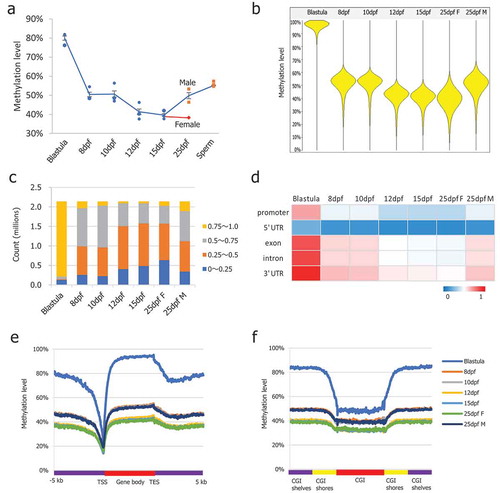
Figure 2. DNA methylation profiles of non-CpG sites and dynamics of repeat elements. (a): Methylation level distribution of 5 kb probes in blastula and 15-dpf medaka PGCs; (b): Non-CpG methylation levels increased significantly in medaka PGCs from 12-dpf and 25-dpf males; (c): Average CpG methylation of the repeat elements in medaka PGCs; (d): The methylation levels of the majority of retrotransposons were found to be between 30% and 50%; (e): RTE showing continued demethylation in PGCs including in 25-dpf female PGCs; (f): Chapaev transposons showing continued demethylation including in 25-dpf female PGCs.
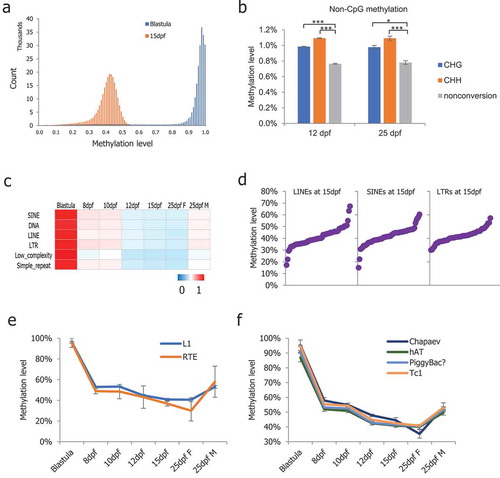
Figure 3. DNA methylation levels of CpG islands in medaka PGCs. (a): Promoter-CGIs showed hypomethylation throughout the PGC reprogramming process, while the non-promoter-CGIs showed hypermethylation throughout the PGC reprogramming period; (b): DMCGIs identified between 10-dpf and 12-dpf PGCs; (c): DMCGIs identified between 15-dpf and 25-dpf male PGCs; (d): Distribution of DMCGIs identified in 10-dpf and 12-dpf PGCs; (e): Distribution of DMCGIs identified in 15-dpf and 25-dpf male PGCs; (f): DMCGIs were hypermethylated in 25-dpf male PGCs and were hypomethylated in 25-dpf female PGCs.
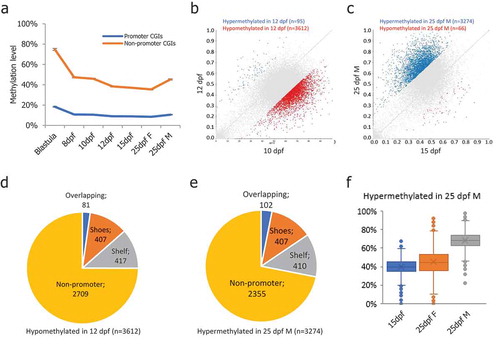
Figure 4. Differentially methylated promoters (DMP) identified during PGC reprogramming. (a): Differentially methylated promoters in PGCs at different stages of life history; (b): DMPs that were hypermethylated in 25-dpf male PGCs were still at the hypomethylated state in female PGCs at the 25-dpf stage indicating de novo methylation taking place in male PGCs earlier than in females; (c): Gene ontology enrichment of DMPs hypomethylated in 12-dpf compared with 10-dpf PGCs; (d): Gene ontology and pathway enrichment of DMPs hypomethylated in 25-dpf male compared with 15-dpf PGCs.
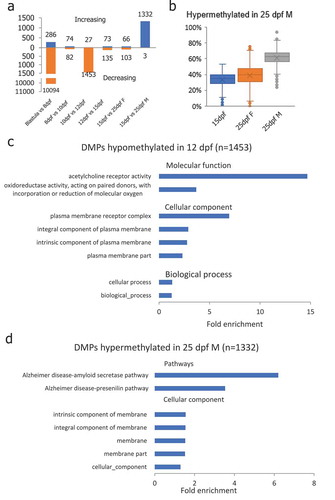
Figure 5. Expression of DNA methyltransferases (DNMT) and TET methylcytosine dioxygenases during specification of PGCs as measured by real-time qRT-PCR. Gene expression in all the stages was normalized to expression in 25-dpf male PGCs (set as 1). Beta-actin (β-actin) was used as an internal control. RQ: Relative quantification. (a): dnmt1, one-way ANOVA showed p < 0.05, Tukey’s multiple comparisons test showed significant differences between 15-dpf and 25-dpf female PGC samples; (b): dnmt3aa, one-way ANOVA showed no significant differences among the examined stages; (c): dnmt3ba, one-way ANOVA showed no significant differences among the examined stages; (d): dnmt3bb.1, one-way ANOVA showed p < 0.05, Tukey’s multiple comparisons test showed significant differences between 10-dpf vs 15-dpf, 25-dpf female and 25-dpf male PGC samples; (e): tet1, one-way ANOVA showed no significant differences among the examined stages; (f): tet2, one-way ANOVA showed p < 0.001, Tukey’s multiple comparisons tests showed significant differences between 10-dpf vs 12-dpf, 15-dpf, 25-dpf female and 25-dpf male PGC samples; (g): tet3, one-way ANOVA showed no significant differences; (h): A relationship between dnmt3ba, tet2 expression and global 5-mC levels. Data represent the mean ± SEM. Asterisk indicates statistical significance (*p < 0.05, **p < 0.01, ***p < 0.001).
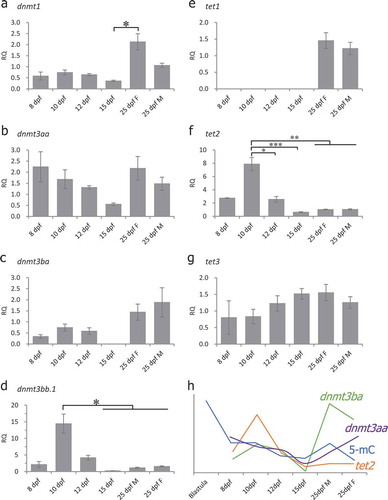
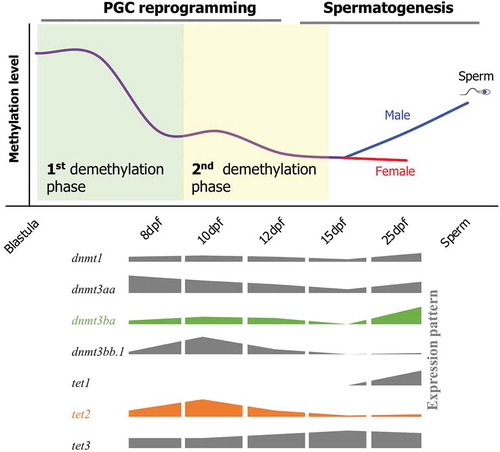
Figure 6. A schematic of DNA methylation dynamics during reprogramming of PGCs in medaka. Demethylation in PGCs occurs in two phases. The first phase occurs prior to 8-dpf (First demethylation phase), and the second phase lasts from the 10-dpf to 12-dpf stage (second demethylation phase). Global DNA methylation level increase from 15-dpf to 25-dpf stage in male PGCs, whereas female PGCs still remain hypomethylated. Cartoons representing expression patterns of the genes involved in DNA methylation and hydroxymethylation are shown on the lower panel.