
Figures & data
Figure 1. Correlation of normalized methylation β values in 450K vs EPIC arrays. (a) Correlation of β values between the OAK5 cartilage sample assayed on the 450K array and the EPIC array (Pearson’s r = 0.99). (b) β value correlation of the same sample (OAK5) assayed twice on the EPIC array (Pearson’s r = 0.99). (c) β value correlation heatmap of all 21 cartilage samples assayed on both the 450K and EPIC arrays.
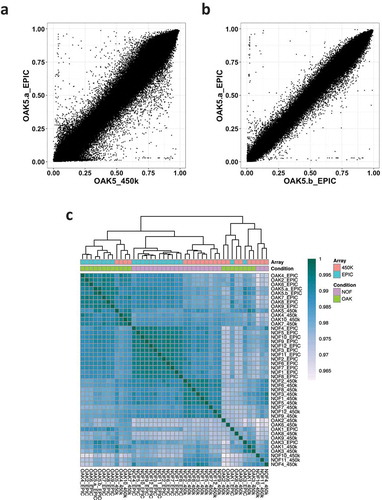
Figure 2. Correlation and variance of methylation β values by probe type. (a) Methylation (β value) variance plotted against the Pearson correlation coefficient across common CpG sites in 450K and EPIC arrays. Variance is the mean of the 450K and EPIC variances across the 21 samples. (b) Density of β value variance by probe type. Type I probes are shown in red and type II probes are in blue. (c) Density of Pearson correlation coefficient r by probe type. Type I probes are red, type II probes are in blue, and the combined Pearson coefficient of both probe types are in green. (d) Mean methylation β values by probe type and correlation group. CpG sites with low correlation (r < 0.2) are denoted by a dashed line, whereas high correlation (r > 0.8) is marked with solid lines.
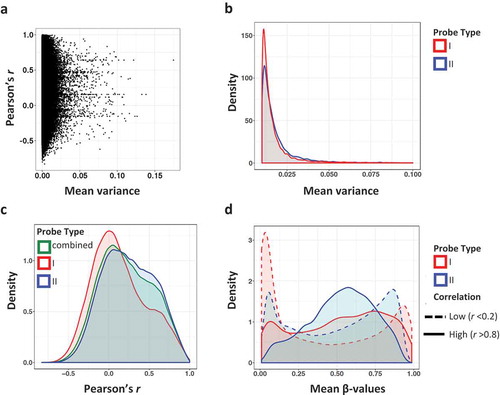
Figure 3. Pearson correlation and β value variance of CpG sites across 450K and EPIC arrays in three tissue types. Common samples assayed on both 450K and EPIC arrays were investigated in whole blood (GEO GSE86833) and paediatric brain tumour (GEO GSE92580). (a) Percentage of probes grouped by Pearson’s r values. (b) Density plot of Pearson’s r of CpG sites in cartilage (red), whole blood (green), and whole tumour (blue). (c) Density plot of mean variance (450K and EPIC) in cartilage, whole blood, and whole tumour. (d) Venn diagram of low correlation (r< 0.2) sites in cartilage, tumour, and whole blood. (e) The grouped distribution of Pearson’s r values in cartilage, tumour, and whole blood of low correlating probes (r ≤ 0.2) identified in 108 placental samples by Fernandez–Jimenez and colleagues (ref [Citation5]). (f) Pearson r distribution of differentially methylated CpGs between OA knee and NOF cartilage samples plotted against ∆β thresholds. The cartilage r distribution for all probes is shown on the left for comparison. (g) Mean β differences per CpG between 450K and EPIC arrays. Sites with higher mean β values in the 450K array are highlighted in red and those higher in the EPIC array are highlighted in blue. (h) Per CpG Pearson’s r against absolute mean difference β values between 450K and EPIC arrays.
![Figure 3. Pearson correlation and β value variance of CpG sites across 450K and EPIC arrays in three tissue types. Common samples assayed on both 450K and EPIC arrays were investigated in whole blood (GEO GSE86833) and paediatric brain tumour (GEO GSE92580). (a) Percentage of probes grouped by Pearson’s r values. (b) Density plot of Pearson’s r of CpG sites in cartilage (red), whole blood (green), and whole tumour (blue). (c) Density plot of mean variance (450K and EPIC) in cartilage, whole blood, and whole tumour. (d) Venn diagram of low correlation (r< 0.2) sites in cartilage, tumour, and whole blood. (e) The grouped distribution of Pearson’s r values in cartilage, tumour, and whole blood of low correlating probes (r ≤ 0.2) identified in 108 placental samples by Fernandez–Jimenez and colleagues (ref [Citation5]). (f) Pearson r distribution of differentially methylated CpGs between OA knee and NOF cartilage samples plotted against ∆β thresholds. The cartilage r distribution for all probes is shown on the left for comparison. (g) Mean β differences per CpG between 450K and EPIC arrays. Sites with higher mean β values in the 450K array are highlighted in red and those higher in the EPIC array are highlighted in blue. (h) Per CpG Pearson’s r against absolute mean difference β values between 450K and EPIC arrays.](/cms/asset/acf999dd-cdb3-4ab5-98d6-963a6ccd4fb3/kepi_a_1700003_f0003_oc.jpg)