Figures & data
Figure 1. Study design for methylation and expression association with depression using four cohorts. Blood associations between DNA methylation and depression risk, genotype and mRNA expression were investigated using two independent cohorts, i.e. the discovery cohort and methylation-expression cohort. In brain, methylation and mRNA levels were separately analysed in relation to MDD in two independent cohorts. * Individuals with depression DAWBA band risk scores below 15% and MADRS-S scores <9 were defined as ‘Controls’, while individuals with depression DAWBA level bands 3 (≈ 15%), 4 (≈ 50%) or 5 (>70%) and MADRS-S scores ≥9 were assigned to the ‘Cases’ category. SNPs: single nucleotide polymorphisms; MDD: major depression disease.
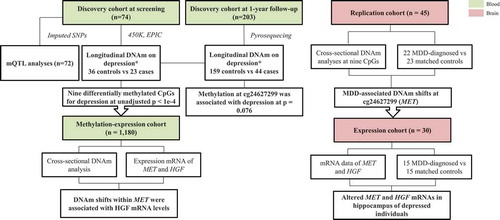
Table 1. Characteristics of the adolescents from the discovery cohort at follow-up.
Table 2. Characteristics of individuals in the replication cohort.
Figure 2. Manhattan plot of the longitudinal epigenome-wide association of depressive-transformed variable in whole-blood samples of 59 adolescents. The depressive-transformed variable was calculated based on depression DAWBA band risk scores and MADRS-S scores. The blue line represents the significance level at p = 10−4.
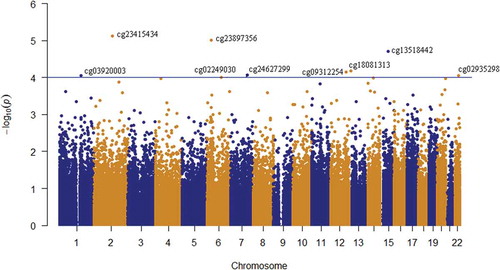
Figure 3. Blood DNAm levels (β-values) at cg24627299 within the MET gene for adolescents defined as ‘controls’ and ‘cases’. Individuals with depression DAWBA band risk scores below 15% and MADRS-S scores <9 were defined as ‘Controls’, while individuals with depression DAWBA level bands 3 (≈ 15%), 4 (≈ 50%) or 5 (>70%) and MADRS-S scores ≥9 were assigned to the ‘Cases’ category.
Table 3. List of differentially methylated CpG sites in longitudinal analyses.
Figure 4. Methylation levels at cg24627299 (MET) in brain samples of MDD-diagnosed individuals and controls.
Table 4. Differentially methylated CpG sites in the brain.
Figure 5. LD matrix of the 39 investigated genetic variants within the ±100 kbp of the differentially methylated CpG site (cg24627299, MET gene).
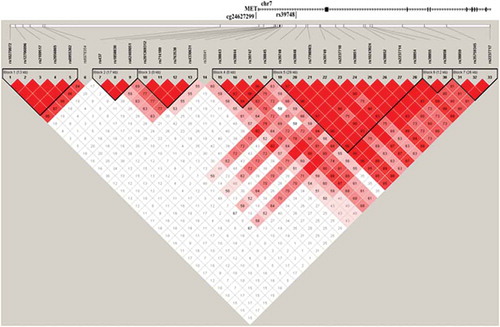
Table 5. Distribution of the rs39748 eQTL contribution across the tissues.
Figure 6. a) MET and HGF expression levels among different brain regions and whole blood. b) Genomic context of the most significant CpG site associated with the depressive phenotype in the longitudinal analyses. Genomic positions of RefSeq genes are displayed in the bottom part and indicated by arrows. The position of the significant CpG site is highlighted by black lines. Since analyses were performed based on data obtained in blood, chromatin marks overlapping in brain and blood cells were investigated. Chromatin states of eight tissues downloaded from the 37/hg19 WashU Epigenome Browser are illustrated. Each functional role of a segment is indicated by a particular colour. BrainAC: brain anterior caudate; BrainCG: brain cingulate gyrus; BrainHIPPO: brain hippocampus; BrainITL: brain inferior temporal lobe; BrainDPC: brain dorsolateral prefrontal cortex; BrainSN: brain substantia nigra; BrainAG: brain angular gyrus; PBMC: peripheral blood mononuclear primary cells.
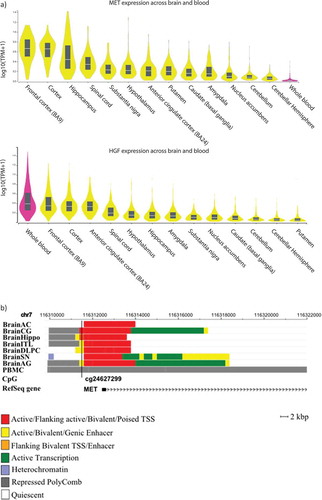
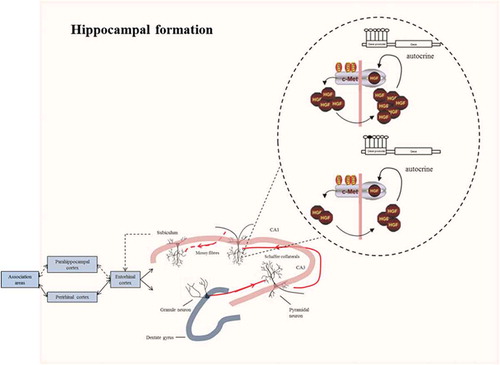
Figure 7. Connections in the hippocampal formation. In the hippocampus, sensory information arrives from the cerebral association neocortex via the entorhinal cortex, parahippocampal gyrus and/or perirhinal cortex. The hippocampal subfield CA1 sends axons to both subcortical areas and the deep layers of the entorhinal cortex, either directly or through the subiculum. Processed information is sent back from the hippocampal CA1 area to the cerebral association cortex through the same pathway. Higher methylation levels at the promoter of MET may alter the autocrine mechanism of HGF/c-MET signalling necessary for promoting axonal growth at the excitatory synapses of the CA1 hippocampal pyramidal neurons. The response to the environmental stimuli may therefore be altered, leading to depressive symptoms.