Figures & data
Figure 1. Some known natural and synthetic STACs. Structures and concentrations required to increase SIRT1 activity by 50% above control (EC1.5) of the small molecules indicated.
Figure 2. In vitro identification and characterization of SCIC1 and SCIC2. (a) Chemical structures. (b) SIRT1 assay for SCIC1 and SCIC2 at 10 μM. STAC2 and EX-527 (at 10 μM) were used as enzymatic controls. (c) NMase assay for SCIC and SCIC2. (d-e) Dose-response curve determining AC50 of SCIC1 (d) and SCIC2 (e). Values are mean ± SD; experiments were performed in triplicate.
Figure 3. Surface plasmon resonance study on interaction of SCIC1 and SCIC2 with SIRT1. Binding affinity was measured as equilibrium dissociation constant (KD). EX-527 was used as positive control.
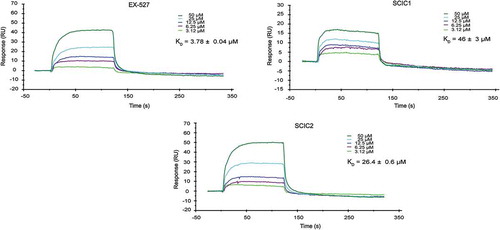
Figure 4. Molecular modelling of recognition between SCIC2 and SIRT1. (a) Binding mode of SCIC2 to SIRT1 open conformation structure. Protein surface is coloured orange (NTD) and cyan (CD), and ligand is represented by grey spheres. (b) Close-up view of SCIC2 binding mode as predicted by docking calculations. Protein is shown as orange stick and ribbons, and ligand as grey sticks. (c) Binding mode of SCIC2 to SIRT1 closed conformation structure. Protein surface is coloured orange (NTD) and cyan (CD), and ligand is represented by grey spheres. (d) Close-up view of SCIC2 binding mode as predicted by docking calculations. Protein is shown as orange stick and ribbons, and ligand as grey sticks. (e) X-ray binding mode of resveratrol (green sticks) superimposed on the theoretical one of SCIC2 (grey sticks). Protein is shown as orange and cyan ribbons.
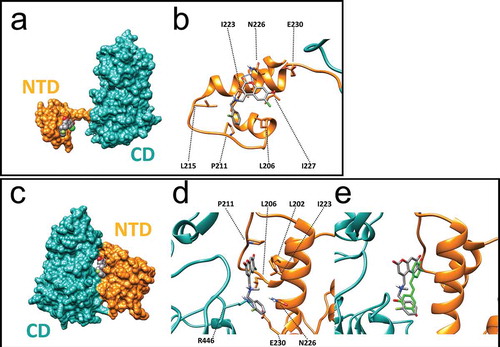
Figure 5. In vitro identification of SCIC2.1. (a) Chemical structure. (b) SIRT1 assay for SCIC2.1. STAC2, EX-527, and SCIC2 (at 10 μM) were used as enzymatic controls. (c) NMase assay for SCIC2.1. (d) Dose-response curve determining AC50 of SCIC2.1. (e) Western blot analysis for SIRT1 and relative quantization based on CETSA. Values are mean ± SD; experiments were performed in triplicate.
Table 1. In vitro evaluation of SCIC2 and SCIC2.1 permeability.
Table 2. HepG2 cell medium and human serum (HS) stability profiles of SCIC2 and SCIC2.1 after different intervals of incubation. Relative concentrations and identity of the compounds were determined by integration of the A220 peaks from RP-HPLC-ESI.
Figure 6. SCIC2 and SCIC2.1 do not affect cell cycle of HepG2 and H9c2 cell lines. (a−b) FACS analysis showing cell cycle progression of HepG2 (a) and H9c2 (b) cells. (c−d) Cell death analysis of HepG2 (c) and H9c2 (d) cells. Values are mean ± SD; experiments were performed in triplicate.
Figure 7. Effects of SCIC2 and SCIC2.1 on p53 acetylation. (a−b) Western blot analyses for p53 and p53K382/381ac from whole extracts of HepG2 and H9c2 cells treated with indicated compounds at indicated doses and times. Band quantification was performed using ImageJ software. Values are mean ± SD; experiments were performed in triplicate.
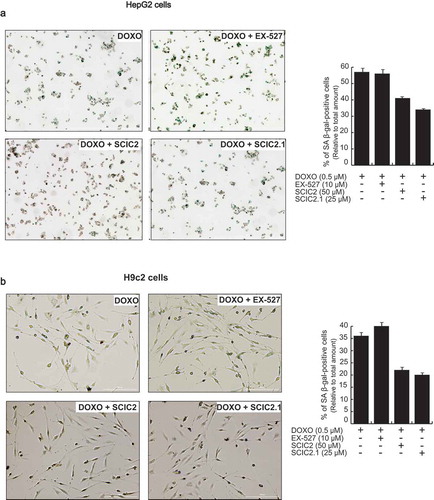
Figure 8. Effect of SCIC2 and SCIC2.1 on senescence in HepG2 and H9c2 cell systems. (a-b) Analysis of senescence-associated β-galactosidase (SA-β-gal) activity in HepG2 (a) and H9c2 (b) cells. Panels represent the ratio between positive (green) cells and total cells. Values are mean ± SD; experiments were performed in triplicate.