Figures & data
Table 1. Patients characteristics.
Figure 1. The flow diagram of ARs screening.
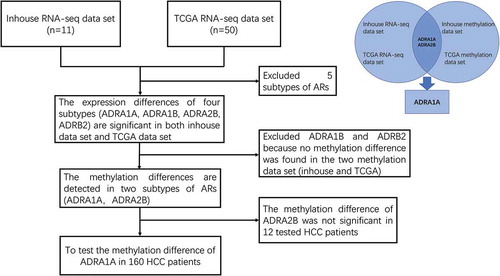
Figure 2. The expression and methylation levels of adrenoreceptors (ARs) in HCC from inhouse and TCGA data-set. (a) The expression levels of ARs from our inhouse data-set. (b) The expression levels of ARs from TCGA data-set. (c) The methylation levels of ADRA1A from inhouse data-set. (d) The methylation levels of ADRA1A from TCGA data-set. (e) The methylation levels of ADRA2B from inhouse data-set. (f) The methylation levels of ADRA2B from TCGA data-set. FPKM: fragments per kilobase million; *P < 0.05, **P < 0.001, ***P < 0.0001, NS: not significant.
Figure 3. The expression levels of ADRA1A in HCC cell lines and tissues. (a) The expression levels of ADRA1A protein in HCC and LO2 cell lines; Ratio refers to the result of the grey values ADRA1A bands and GAPDH bands. (b) The mRNA expression levels of ADRA1A in HCC and LO2 cell lines. (c) The representative immunohistochemical results of ADRA1A in HCC tissue and paired non-cancerous tissue. Scale bars = 200μm. (d) The score of immunohistochemical results in all 20 paired HCC samples. (e) The proportion of ADRA1A expression regulation in all 20 paired HCC samples. (f) The overall survival (OS) data of ADRA1A from the Gene Expression Profiling Interactive Analysis website (http://gepia.cancer-pku.cn), a network analysing TCGA data online. *P < 0.05.
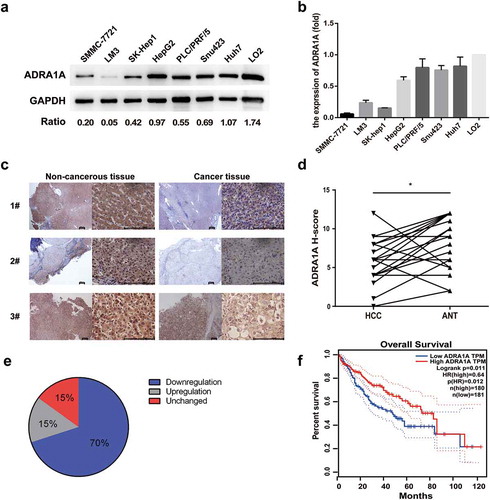
Figure 4. The identification of transcriptional activity and correlation of CpG sites in ADRA1A promoter. (a) The schematic diagram and sequence of CpG sites of ADRA1A promoter amplicon. (b) The verification of transcriptional activity in selected amplicon via luciferase assay. (c) The methylation levels of all CpG sites in ADRA1A promoter region from our study. (d) Heatmap of correlation analysis between the methylation levels of different CpG sites in ADRA1A. Upper-right triangle: Heat map of Pearson r values. Lower-left triangle: Heat map of P values. *P < 0.05, ***P < 0.0001, NS: not significant.
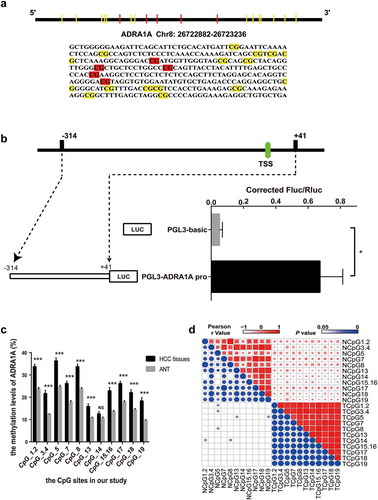
Table 2. Methylation status (%) of ADRA1A in hepatocellular carcinoma patients.
Figure 5. The correlation between methylation status and expression levels of ADRA1A from inhouse and TCGA data-set and the expression levels of ADRA1A for DAC treatment. (a) The correlation between the methylation of cg09557462 and ADRA1A gene expression from inhouse data-set. (b) The correlation between the methylation of cg02409177 and ADRA1A gene expression from inhouse data-set. (c) The correlation between the methylation of cg20303399 and ADRA1A gene expression from the TCGA data-set. (d) The correlation between the methylation of cg07645844 and ADRA1A gene expression from the TCGA data-set. (e) The mRNA expression levels of ADRA1A in LM3 and SMMC-7721 cell lines with different DAC concentration treatment. (f) Gel image of ADRA1A promoter Methylation specific PCR (MSP). M: methylated; U: unmethylated.
Figure 6. The association between the methylation levels of ADRA1A and clinicopathological features. (a) The association between the mean methylation levels of ADRA1A and alcohol intake or AFP. (b) The expression difference of four isoforms of ADRA1A between normal and alcohol hepatitis patients. (c) The association between the methylation levels of CpG sites and liver cirrhosis stage. (d) The ROC curves of methylation levels in 14 CpG sites of ADRA1A promoter between HCC tissues and ANT. *P < 0.05, **P < 0.001, ***P < 0.0001.
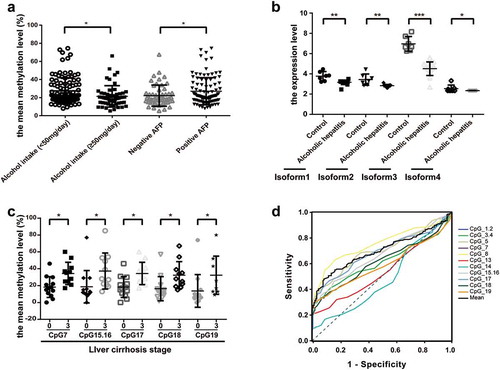
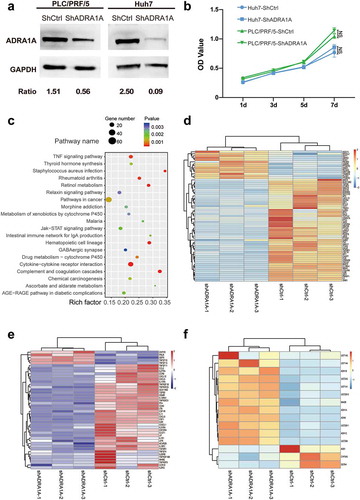
Figure 7. Differential gene expression between ADRA1A knockdown group and control group in HCC cell lines by RNA-sequencing. (a) Representative western blot of ADRA1A in PLC/PRF/5 and LM3; Ratio refers to the result of the grey values ADRA1A bands and GAPDH bands. (b) Detection of cell proliferation for shADRA1A and shCtrl in two HCC cell lines. (c) Top 20 signalling pathways obtained by RNA-sequencing between PLC/PRF/5-shADRA1A and PLC/PRF/5-shCtrl (n = 3). (d, e, f) Heat map of differentially expressed genes for pathways in caner (d), cytokine-cytokine receptor interaction pathway (e) and drug metabolism-cytochrome P450 pathway (f).