
Figures & data
Figure 1. CRISPR-Cas9 screening for epigenetic factors. (a) Schematic overview for CRISPR-Cas9 screen in K-562 cells. Cas-9 expressing K-562 cells were transduced with chromatin-UMI library. Cells were treated with 5 nM PMA for 72 h, sorted and sequenced (n = 2). (b) Representative Flow cytometry chart for CRISPR-Cas9-K-562 cells after 5 nM PMA treatment for 72 h. Treated cells were sorted for CD61 and CD41 with three different gatings: P1 (CD61/CD41−), P2 (CD61/CD41++), and P3 (CD61+). (c) Venn diagram graph shows significant (Hypogeometric distribution P = 1.58 E-11) overlap of enriched sgRNAs between two biological replicates of the CRISPR-Cas9 screens.
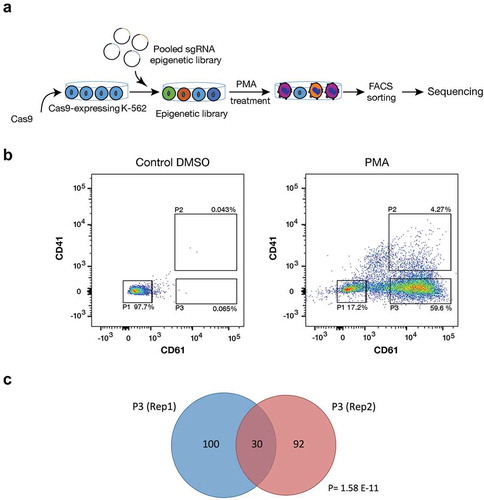
Figure 2. Enriched genes in the P3 population from the CRISPR-Cas9 screen. Sequencing read counts for guides targeting each gene in P3 vs unsorted cells. Replicate overlap of the top 10% enriched genes (in red) and specific genes of interest are highlighted. (a) Genes significantly enriched after 72-h treatment with PMA were identified with MAGeCK program. A modified robust ranking aggregation (RRA) algorithm was used to rank sgRNAs based on p-values.
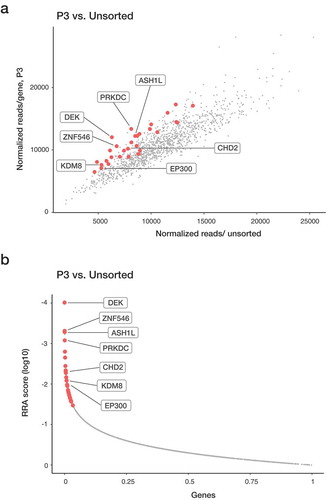
Figure 3. CHD2 KO causes megakaryocytic characteristics. (a) Representative flow cytometry chart for uninduced (DMSO) CHD2 KD versus control sample. The proportions of the cells for CD61 and CD41 were analysed with flow cytometry in three different populations (P1, P2 and P3). (b) Bar graphs show proportions of different cell populations for CD61 and CD41 markers for CHD2 KO versus Control samples. Data are represented as means ± SD. The p-values were calculated using an unpaired t-test with Welch’s correction (n = 5).
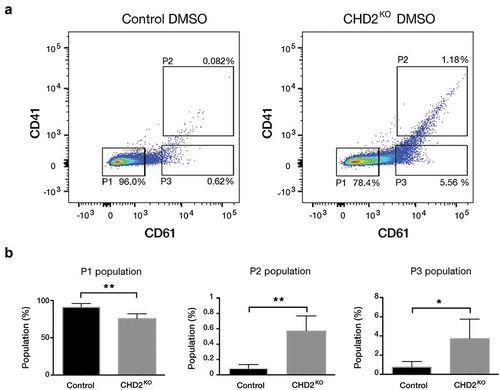
Figure 4. PMA increases megakaryocytic characteristics in CHD2 KO K-562 cells. (a) Representative flow cytometry chart for CHD2 KO versus control sample with PMA treatment (5 nM for 24 h) and the percentage of CD61 and CD41 surface markers in three different population: P1, P2, P3. (b) Bar graphs show proportions of different cell populations for CD61 and CD41 markers for CHD2 KO versus control samples. Data are represented as means ± SD. The p-values were calculated using an unpaired t-test with Welch’s correction (P = 0.0427 for P2) (n = 5).
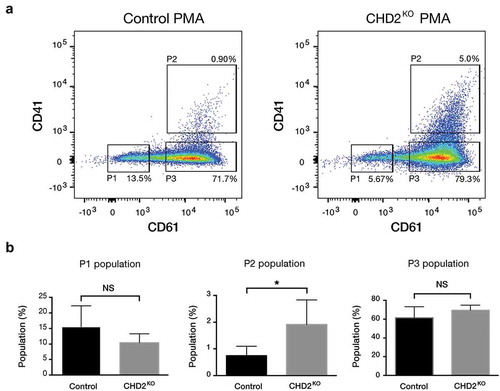
Figure 5. Proliferation rate is lower in CHD2 knocked down cells. (a) Bar chart for the slope of logarithmic growth cells for CHD2 KD cells compared to control cells for 3 interval days. Cells were counted using Trypan blue as dead cell exclusion marker with a viability of over 95% (n = 4). The slope of the growth between day 1 and day 2 has P = 0.0454 for which indicate the difference in growth between CHD2 KD and control cells are significant. (b) Bar chart for the number of colonies in CFU assay. Data are represented as means ± SD. The p-values were calculated using an unpaired t-test with Welch’s correction (n = 3).
Figure 6. CHD2 target genes in K-562 are involved in a great variety of cellular processes and correlated with high expression levels. (a) CHD2-enriched gene ontology (GO) terms are visualized using REVIGO [Citation37], which allows to cluster GO terms according to their similarity in a semantic space. GO terms with a p-value ≤0.001 are shown using ‘medium’ for the allowed semantic similarity. (b) Global expression levels (extracted from CAGE FANTOM data [Citation20]) between CHD2 target genes and non-target genes in K-562. P-value <0.001. tpm, transcript per million. (c) RNA-sequencing analysis of CHD2 KO and control cells integrated with CHD2 ChIP-sequencing data from K-562 cells retrieved from the ENCODE project (ENCSR000EHD). (d) Venn diagram showing between the overlap between CHD2 target genes in K-562 cell line and CHD2 co-regulated genes in TCGA AML cohort.
![Figure 6. CHD2 target genes in K-562 are involved in a great variety of cellular processes and correlated with high expression levels. (a) CHD2-enriched gene ontology (GO) terms are visualized using REVIGO [Citation37], which allows to cluster GO terms according to their similarity in a semantic space. GO terms with a p-value ≤0.001 are shown using ‘medium’ for the allowed semantic similarity. (b) Global expression levels (extracted from CAGE FANTOM data [Citation20]) between CHD2 target genes and non-target genes in K-562. P-value <0.001. tpm, transcript per million. (c) RNA-sequencing analysis of CHD2 KO and control cells integrated with CHD2 ChIP-sequencing data from K-562 cells retrieved from the ENCODE project (ENCSR000EHD). (d) Venn diagram showing between the overlap between CHD2 target genes in K-562 cell line and CHD2 co-regulated genes in TCGA AML cohort.](/cms/asset/12f6d5b1-a24c-4bf5-bd64-771c76aa40ef/kepi_a_1710913_f0006_c.jpg)