
Figures & data
Figure 1. Matched normal tissue is epigenetically benign. (a), generalized additive model indicates that tumor group had increased methylation at probes hypomethylated in MN, whereas TB had a near-linear relationship with MN. (b), Schematic methylation maps for GSTP1, APC, SFRP2 and RASSF1 genes and DMRs (tumor versus MN). Gene structure and CpG islands (green) are indicated below the graphs. DMRs are indicated in the red boxes and show probes contained within the rank cut-off identified through the RnBeads differential methylation analysis. For comparative purposes, the β-values (extracted from a HM450K platform) for a cohort of TB prostate tissues from men with no evidence of PCa are also indicated. EPIC/HM450K probe β-values are indicated by filled circles. Statistical analysis was carried out using a Kruskal–Wallis and Dunn’s multiple comparison tests. P-values are as follow: *P≤ 0.05, ** P≤ 0.01, *** P≤ 0.001. Abbreviations: MN: matched normal, TB: true benign, DMRs: differentially methylated regions.
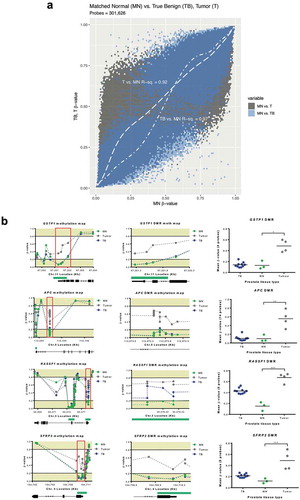
Figure 2. Analysis of DNA methylation profiles between tissue and liquid biopsies. (a), Spearman’s correlation matrix showing DNA methylation profiles of tissue and liquid biopsies at the DMPs level (n = 32,452). Probe methylation values scatter-plot (lower panel), overall methylation distribution per sample (middle panel) and Spearman’s correlation values (upper panel) are depicted. All values are statistically significant (P < 0.001). (b), Deconvolution results for all 16 matched samples from the subjects included in the study. A reference methylation atlas was used to quantify the contribution of each cell type to the tissue and liquid biopsy samples, using the methylation data from the EPIC array. Only cell types that contribute > 1% are shown. (c), Proportion of prostate tissue detected across sample types. Each group of connected dots represents a subject, as indicated by the numbers displayed on the far left of the graph. (d), Heatmap with unsupervised clustering showing the methylation levels of the top 25% most DMPs between tumor and MN. This is shown for the hyper- (left) and hypomethylated (right) datasets (hyper and hypo correspond to a higher or lower, respectively, methylation seen in tumor vs MN). Colour key pertains to the level of methylation observed (0 – hypomethylated; 1 – hypermethylated). Columns indicate different samples, with a mean of several subjects being displayed for tumor (n = 4) and MN (n = 3). Rows indicate hyper- (6,040) and hypomethylated (2,074) DMPs. E, Schematic methylation map for RASSF1 DMR using selected DMPs from top 25% analysis. Gene structure and CpG islands (green) are indicated. Mean value was calculated based on the number of probes in the DMR, and all probes are consecutive in the chromosome. Subjects methylation values are shown as a group in MN and tumor, and individually for Plasma and US. Abbreviations: DMP – Differentially methylated probe; DMR – Differentially methylated region; MN – Matched normal; P – Plasma; US – Urine Sediment.
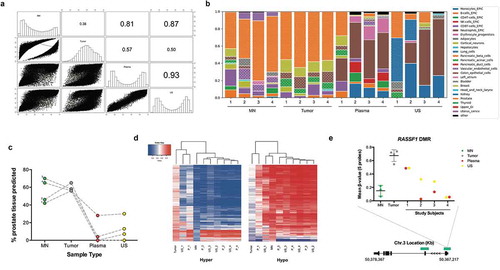
Figure 3. Annotation of DMRs. (a), Distribution of tumor-specific DMRs detected in liquid biopsies, by chromosome, genetic and epigenetic domains. (b), Functional enrichment analysis of DMGs in the hypermethylated dataset. GO biological process terms were ranked by FDR corrected P-value and the top 100 (P < 0.05) were selected for the descriptive analysis. Each enriched component shows the percentage of genes (grey bar) and percentage of biological processes (blue bar) involved. Abbreviations: DMR – Differentially methylated region; BPs – Biological processes; DMGs – Differentially methylated genes; MN – Matched normal; US – Urine Sediment.
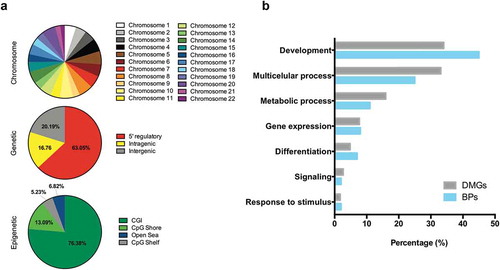
Table 1. Sensitivity of tumor-DMP detection by liquid biopsies.