Figures & data
Figure 1. Obesity-trait or osteoporosis-related GWAS Tier-1 SNPs overlap tissue-specific regulatory chromatin in TBX15. (a) The two TBX15 RefSeq gene isoforms, a truncated ENSEMBL isoform, and the upstream noncoding RNA gene (chr1:119,412,120–119,554,007, hg19); the broken arrow at TBX15 shows the main TSS. (b) The location of two nonsynonymous coding SNPs (double arrows) and eight Tier-1 (best regulatory candidates) SNPs; ‘3,’ a cluster of three Tier-1 SNPs. (c) Roadmap-derived chromatin state segmentation of strong (str), weak (wk), or bivalent (biv; poised) promoter or enhancer chromatin or repressed (repr) chromatin; SAT, subcutaneous adipose tissue; ostb, osteoblasts; Sk muscle, skeletal muscle; PBMC, peripheral blood mononuclear cells; fib, fibroblasts; myob, myoblasts; myot, myotubes; LCL, lymphoblastoid cell line; HMEC, mammary epithelial cells; NHEK, embryonic kidney cells; HUVEC, umbilical vein endothelial cells; ESC, embryonic stem cells; dotted horizontal lines, super-enhancers. (d) ENCODE strand-specific total RNA-seq. (e) RNA-seq TPM (log10) from GTEx; the median TPM is given for some of the samples; VAT, visceral adipose tissue. All tracks were visualized in the UCSC Genome Browser and are aligned in this figure and –, and purple labels denote TBX15-expressing samples; grey, non-expressing samples; brown labels, samples expressing predominantly the truncated TBX15 isoform.
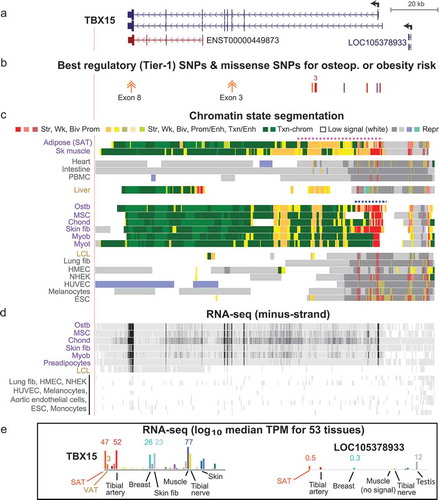
Figure 2. Many obesity-trait or eBMD risk-associated SNPs, EnhPro SNPs, and cis-eQTLs are found in the gene neighbourhood of TBX15. (a) The gene neighbourhood of TBX15 (chr1:119,134,901–119,884,900). (b) Obesity-trait or eBMD GWAS SNPs are designated as EnhPro SNPs if they overlap enhancer or promoter chromatin preferentially in SAT or ostb. (c) All index SNPs, proxy SNPs (r2 ≥ 0.8, EUR) derived from them, and imputed SNPs in this region from obesity-trait or eBMD GWAS. (d) eQTLs for TBX15 or WARS2 in SAT or VAT. (e) Placental mammalian conserved elements (from phastCons track at the UCSC Genome Browser). (f) Chromatin state segmentation as in . (g) CTCF binding determined by Roadmap ChIP-seq. Panels B-D show custom tracks derived from Supplementary Tables 4–6.
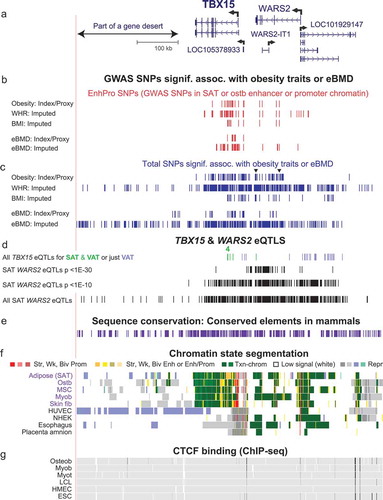
Table 1. Expression of TBX15 is significantly associated with that of the immediately upstream ncRNA gene, LOC105378933, but not with the further upstream WARS2.a
Table 2. Eight best candidates for transcription-regulatory obesity- or eBMD-causal SNPs (Tier-1 SNPs) in the TBX15 neighbourhood.
Figure 6. The genetic architecture of the Tier-1 SNPs at TBX15 suggests that there are multiple causal regulatory SNPs for obesity risk and for osteoporosis risk. (a) The SNPclip program at LDlink [Citation53] was used to trim the Tier-1 SNPs into groups with r2 > 0.2 (EUR); the SNP members of the resulting groups are shown in pie charts. (b) The haplotypes for trimmed Group I are shown with designations of trait-increasing (trait ↑) or trait-decreasing (trait ↓) alleles; the trait-increasing alleles from obesity GWAS are the risk alleles but for eBMD GWAS they are the non-risk alleles because of the osteoporosis-protective effects of high BMD.
![Figure 6. The genetic architecture of the Tier-1 SNPs at TBX15 suggests that there are multiple causal regulatory SNPs for obesity risk and for osteoporosis risk. (a) The SNPclip program at LDlink [Citation53] was used to trim the Tier-1 SNPs into groups with r2 > 0.2 (EUR); the SNP members of the resulting groups are shown in pie charts. (b) The haplotypes for trimmed Group I are shown with designations of trait-increasing (trait ↑) or trait-decreasing (trait ↓) alleles; the trait-increasing alleles from obesity GWAS are the risk alleles but for eBMD GWAS they are the non-risk alleles because of the osteoporosis-protective effects of high BMD.](/cms/asset/91f58fc8-d8ac-4db8-a11e-0f80ef06af6c/kepi_a_1716491_f0006_c.jpg)
Figure 3. The 5ʹ end of TBX15 contains all eight Tier-1 SNPs. (a) TBX15’s alternative first exons, part of intron 1 (chr1:119,484,631–119,535,630), and its main TSS (broken arrow). (b) WHRadjBMI and eBMD imputed SNPs that are EnhPro SNPs. (c) The eight EnhPro SNPs that qualify as Tier-1 SNPs; ‘2’ indicates two adjacent Tier-1 SNPs. (d) Chromatin state segmentation as in previous figures; Panc isl, pancreatic islets; Astroc, cultured astrocytes; CpG islands, CpG-rich regions as defined at the UCSC Genome Browser. (e) DNaseI hypersensitivity, vertical viewing range 0–10. (f) H3K27ac signal; vertical viewing range 0–4. (g) Binding of miscellaneous TFs to this region in a variety of cell cultures but not including ostb or adipocytes (see Supplementary Table 8). Coloured tick marks indicate positions of Tier-1 SNPs.
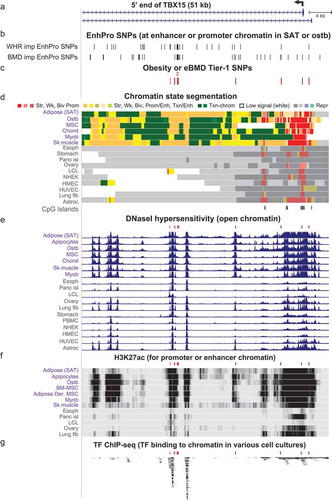
Figure 5. Zoomed in view of four Tier-1 SNPs in the middle of TBX15 intron 1. (a) The common SNPs in this subregion of intron 1 of TBX15 (chr1:119,500,183–119,508,182). (b-e) EnhPro SNPs and the subset of EnhPro SNPs that are designated Tier-1 SNPs, chromatin state segmentation, DNaseI hypersensitivity, and histone modifications as in except that the CpG island track is not shown due to there being no CpG islands in this region. In panel B, lollipops denote the two TBX15 eQTLs for SAT.
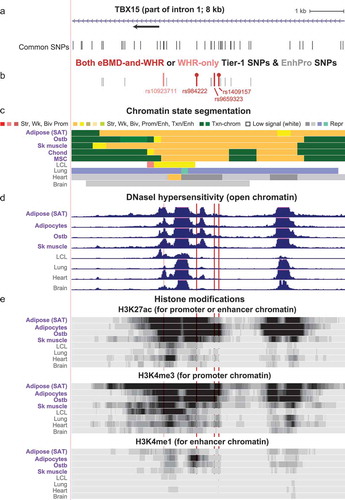
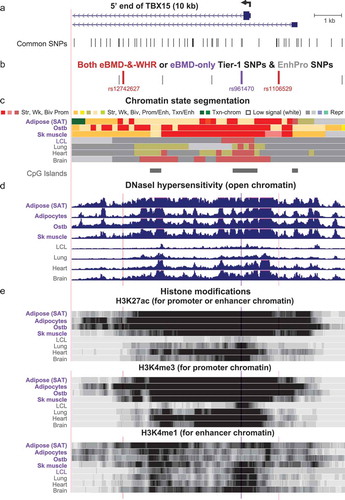
Figure 4. Zoomed in view of three Tier-1 SNPs near the main TSS of TBX15. (a) The common SNPs (version 151) at the 5ʹ end of TBX15 (chr1:119,523,915–119,533,914). (b) The eBMD-and-WHRadjBMI or eBMD-only Tier-1 SNPs are shown in red or purple, respectively; EnhPro SNPs that did not meet all the criteria for Tier-1 SNPs are denoted by short grey bars. (c), (d), and (e) as in except that the vertical viewing range for DNaseI hypersensitivity was 0–7 and H3K4me3 and H3K4me1 are shown in addition to H3K27ac. Highlighting denotes the positions of Tier-1 SNPs.