
Figures & data
Table 1. Sample characteristics.
Table 2. Ten CpG sites with lowest p-values in meta-analysis of epigenome-wide associations with bullying exposure.
Figure 1. Change in DNA methylation pre- and post- bullying exposure measurement for exposed and non-exposed in Generation R and ALSPAC. Data are residualized for covariates present in linear mixed model.
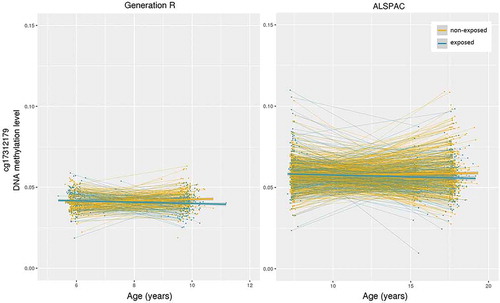
Table 3. Characteristics of CpG sites selected for various levels of significance in meta-analysis.
Supplemental material