
Figures & data
Figure 1. Genomic landscape and DNA methylation profile of the DIEXF gene promoter. (a) DNA methylation profile of the AluSq2 element in normal colon and colon cancer samples. Each dot along the line represents an unmethylated (empty), methylated (full black), or partially methylated (grey) CpG dinucleotide (DNA methylation ranges are indicated). Arrowhead indicates the location of the SmaI site reported by AUMA. The Alu side proximal to DIEXF gene (p-AluSq2, coinciding with the free left Alu monomer -FLAM) and the Alu side distal to DIEXF gene (d-AluSq2, coinciding with the free right Alu monomer -FRAM) are indicated. (b) DNA methylation profile of the AluSq2 element in different normal tissues. (c) UCSC genome browser view of the DIEXF gene promoter region. Annotated CpG islands and repetitive elements are indicated. Bisulphite sequencing of the annotated genomic elements in seven normal (embryonic stem cells, induced pluripotent stem cells, fibroblasts and keratinocytes) and colon cancer cell lines. DNA methylation representation was generated using the Methylation plotter application [Citation76].
![Figure 1. Genomic landscape and DNA methylation profile of the DIEXF gene promoter. (a) DNA methylation profile of the AluSq2 element in normal colon and colon cancer samples. Each dot along the line represents an unmethylated (empty), methylated (full black), or partially methylated (grey) CpG dinucleotide (DNA methylation ranges are indicated). Arrowhead indicates the location of the SmaI site reported by AUMA. The Alu side proximal to DIEXF gene (p-AluSq2, coinciding with the free left Alu monomer -FLAM) and the Alu side distal to DIEXF gene (d-AluSq2, coinciding with the free right Alu monomer -FRAM) are indicated. (b) DNA methylation profile of the AluSq2 element in different normal tissues. (c) UCSC genome browser view of the DIEXF gene promoter region. Annotated CpG islands and repetitive elements are indicated. Bisulphite sequencing of the annotated genomic elements in seven normal (embryonic stem cells, induced pluripotent stem cells, fibroblasts and keratinocytes) and colon cancer cell lines. DNA methylation representation was generated using the Methylation plotter application [Citation76].](/cms/asset/1142cb20-6749-4d74-b499-d23457dd85f4/kepi_a_1722398_f0001_oc.jpg)
Figure 2. DIEXF gene transcriptional characterization. (a) DIEXF transcripts according to UCSC genes, RefSeq Gene, Ensembl Gene Predictions and Vega Protein-Coding Annotations databases. (b) Genomic location of northern blot probes and RT-qPCR amplicons used to characterize the expression profiles. (c) Northern blot analysis of DIEXF transcripts in SW480 cell line with seven probes covering different DIEXF transcripts. The molecular weight of the three described transcripts is shown on the right. The arrowhead indicates the new isoform. (d) Northern blot analysis of DIEXF expression using probes B (located in the common region of all transcripts) and E (specific of the long 8.5-kb transcript with an extended 3ʹ-UTR) in different cell lines. PPIA (Cyclophilin A) was used as the mRNA loading control. The methylation status of the AluSq2 region proximal to DIEXF (p-AluSq2) for each sample is indicated in a box next to its name using a greyscale (black: full methylation; grey: partially methylated; white: no methylation; see for more details). (e) Relative expression of DIEXF analysed by RT-qPCR in different cell lines using 3 different primer pairs (Exons 8–9 and 12-3ʹUTRa covering different DIEXF transcripts and 3ʹUTRa specific of the long 8.5-kb transcript). The methylation status of p-AluSq2 for each sample is indicated in a box next to its name using a greyscale (black: full methylation; grey: partially methylated; white: no methylation; see for more details). Expression levels were normalized using two reference genes (PPIA and PSMC4) and represented relative to HCT116 cells.
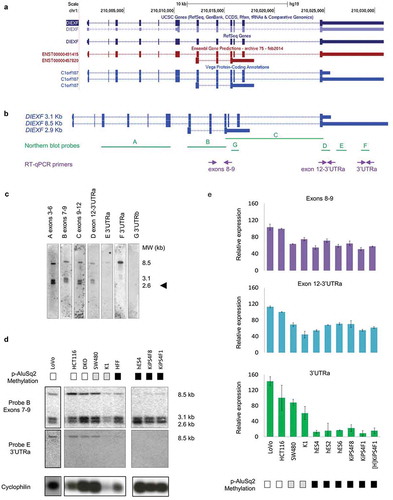
Figure 3. DIEXF protein and mRNA isoforms expression. (a) DIEXF protein expression measured by western blot from cytoplasmic and nuclear fractions in SW480 and HCT116 cell lines using tubulin as a loading cytoplasmic control and TATA as a loading nuclear control. (b) DIEXF protein expression measured by western blot in total extract of different cell lines using tubulin as a loading control. The p-AluSq2 DNA methylation level of each sample is represented in boxes using a greyscale (black: full methylation; grey: partially methylated; white: no methylation; see for more details). (c) Genomic location of the siRNAs used to silence DIEXF targeting different transcripts (siDIEXF#1, siDIEXF#2 and siDIEXF#3). (d) RT-qPCR of DIEXF gene in HCT116 using different sets of primers, at 24, 48, and 72 h after transfection of siRNAs. Expression levels were normalized using two reference genes (PPIA and PSMC4) and expressed relative to Mock. (e) Western blot of DIEXF protein in HCT116 cells at 24, 48, and 72 h after transfection of siRNAs. HCT116 plus Lipofectamine 2000 (Mock) and HCT116 transfected with a non-targeting siRNA (siCtrl) were used as controls. The band that corresponds to DIEXF protein is indicated with an arrowhead.
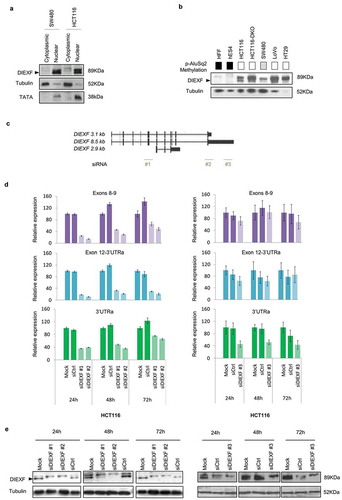
Figure 4. DIEXF 3ʹ and 5ʹ ends characterization. (a) Genomic location of 5ʹ- and 3ʹ-RACE primers. We designed 2 primers to characterize 5ʹ ends (3R and 7R) and 2 other primers to characterize 3ʹ ends (3'UTRaF and 12F). PCR products of 5ʹ-RACE (b) and of 3ʹ-RACE (c) in SW480, HFF, and hES4 cells. Black arrows show the 8.5-kb and 3.1-kb transcripts; red arrows show the novel transcripts; the asterisk indicates the fragment that could not be sequenced.
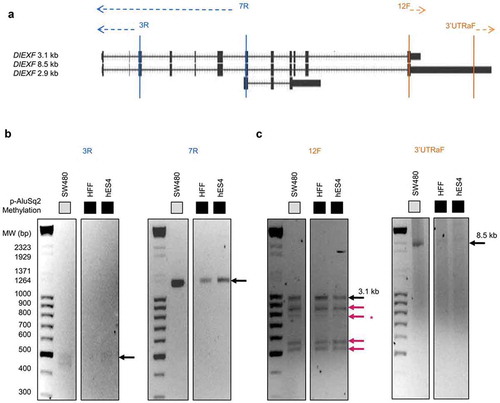
Figure 5. Enrichment in histone modifications associated with active chromatin along the DIEXF promoter region, including Alu repeats, in cell lines with different DNA methylation profile. ChIP assays were performed with antibodies against 3meK4H3, AcK9H3, H3 and non-specific antibody (IgG). Different genomic elements within DIEXF promoter region (see )) were analysed by qPCR. GAPDH (green bar) and 16CEN (red bar) were used as positive and negative control, respectively. Results are reported as enrichment of immunoprecipitated DNA relative to the input. The DNA methylation levels of each region are depicted using a greyscale (black: full methylation; grey: partially methylated; white; no methylation; see for more details).
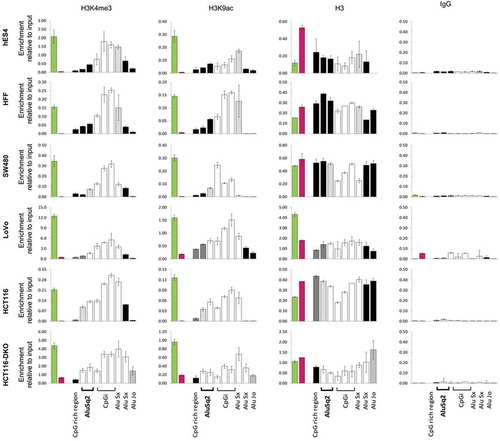
Figure 6. DNA methylation profile of the AluSq2 element in 40 patients with colorectal cancer. DNA samples were analysed by bisulphite sequencing. The methylation level of each CpG (annotated according to its position in the Alu sequence) is displayed using a greyscale in which black corresponds to full methylation and white to full unmethylation. The order of the CpGs has been maintained according to their position in the genome. Samples have been clustered using the ClustVis tool [Citation81] applying Ward clustering and Euclidian distances. Normal (N, green) and tumour (T, orange).
![Figure 6. DNA methylation profile of the AluSq2 element in 40 patients with colorectal cancer. DNA samples were analysed by bisulphite sequencing. The methylation level of each CpG (annotated according to its position in the Alu sequence) is displayed using a greyscale in which black corresponds to full methylation and white to full unmethylation. The order of the CpGs has been maintained according to their position in the genome. Samples have been clustered using the ClustVis tool [Citation81] applying Ward clustering and Euclidian distances. Normal (N, green) and tumour (T, orange).](/cms/asset/087c9675-c388-4189-81f8-02f15d5c8f58/kepi_a_1722398_f0006_oc.jpg)