Figures & data
Table 1. Characteristics of sIUGR and normal MCDA twin pregnancies.
Figure 1. Hydromxymethylation-associated genes detected in sIUGR twin pairs through hMeDIP-chip and mRNA sequencing. (a) Schematic representation for identifying hydroxymethylation-associated genes. The putative targets obtained by overlapping the differentially expressed mRNAs and differentially hydroxymethylation peaks in promoter region. (b) The differentially expressed mRNAs and differentially hydroxymethylation peaks between two placental shares in sIUGR group and normal MCDA group shown on the heatmap. (c) The differentially expressed mRNAs between larger and smaller placental shares of sIUGR plotted in the volcano plot. One hundred eighty-one upregulated genes and 614 downregulated genes identified in smaller placental shares of the sIUGR group. (d) Expression of hydroxymethylation-regulated associated genes detected in the smaller placental shares compared to the larger ones in sIUGR twin pairs by quantitative RT-PCR.
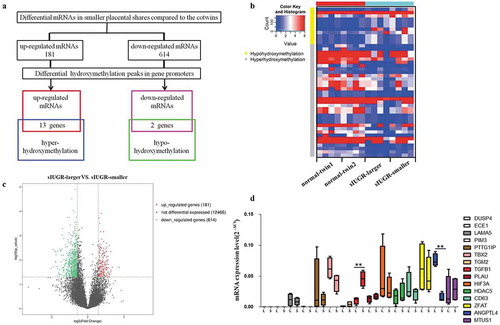
Figure 2. Hydromxymethylation-associated ANGPTL4 identified in sIUGR twin pairs. (a, b) Decreased ANGPTL4 detected in smaller placental shares of the sIUGR group compared to the normal MCDA group by western blotting and quantitative RT-PCR. (**p < 0.01). (c, d) Single staining of maternal villi from sIUGR (smaller & larger) and normal MCDA group (twin1 & twin2) using ANGPTL4 antibody was visualized. Above scale bar = 250 μm. Below scale bar = 50 μm. (e, f) Global 5hmC levels detected in two placental shares of sIUGR group by dot blot. S1-8 was eight pairs of sIUGR placentas (smaller & larger). (g) Correlation analysis of ANGPTL4 expression with global 5hmC level in smaller placental shares compared to larger ones in the sIUGR group. (h, i) Single staining of maternal villi from sIUGR (smaller & larger) and normal MCDA group (twin1 & twin2) using HIF-1α antibody was visualized. Above scale bar = 250 μm. Below scale bar = 50 μm. Compared to the normal MCDA group, weaker positive signal for ANGPTL4 and HIF-1α both detected in smaller placental shares than larger ones in the sIUGR group.
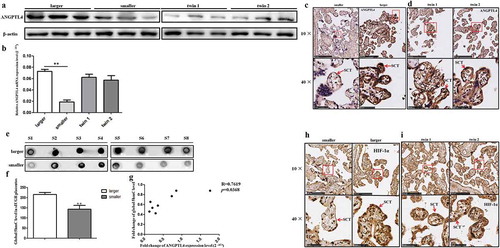
Figure 3. Decreased ANGPTL4 directly inhibited trophoblast invasion and migration in vitro. (a) The expression of ANGPTL4 when using ANGPTL4 siRNA. Decreased ANGPTL4 expression detected when using three siRNAs, of which siRNA3 was the most effective. (b, c) Transwell assays showed that invaded cells reduced when using siRNA3. (**p < 0.01). (d, e) Wound healing assays shown that migrated cells decreased when using siRNA3. (**p < 0.01). (f, g) No significant difference in the apoptopsis and necrosis detected when using siRNA3 by Flow cytometry (FCM). (h) No significant difference in cell viability identified when using siRNA3 by CCK8 assay.
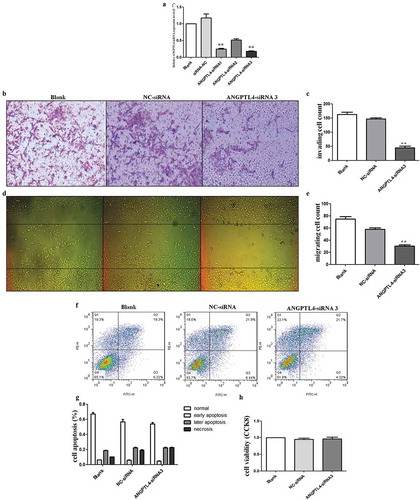
Figure 4. ANGPTL4 is a downstream target of HIF-1α and regulated by HIF-1 signalling pathway in vitro. (a–f) Western blot analysis of HIF-1α and ANGPTL4 expression in HTR8 cells with HIF-1 agonist (DMOG), HIF-1 inhibitor (digoxin) and HIF-1α siRNA for 48 hours. Expressions of HIF-1α and ANGPTL4 both increased when using DMOG, while decreased by using digoxin or HIF-1α siRNA. (g, h) Transwell assays showed that invaded cells increased in DMOG group, and reduced in digoxin group. (**p < 0.01). (i, j) Wound healing assays shown that migrated cells increased in DMOG group, and reduced in digoxin group. (**p < 0.01). (k, l) FCM results showed that late apoptopsis and necrosis of HTR8 cells increased significantly when using digoxin. (**p < 0.01).
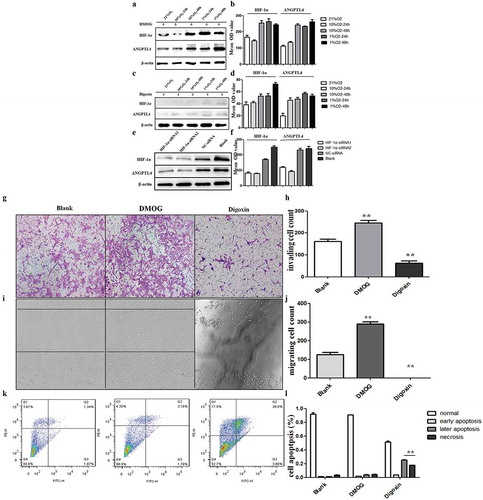
Figure 5. Hypoxia leads to aberrant expression of ANGPTL4 and HIF-1α, positively correlated with their aberrant hydroxymethylation levels in promoter regions. (a, b) Western blot results showed the protein levels of HIF-1α and ANGPTL4 under normoxic conditions with 21%O2 and under hypoxic conditions with 10% and 1% O2 for 24 hours and 48 hours. Expression of HIF-1α and ANGPTL4 both highly expressed in 10%O2-48 hours and reduced expressed in 1%O2-48 hours. (c, d) The 5hmC levels in the promoters of HIF-1α and ANGPTL4 under normoxic and hypoxic conditions were detected by hMeDIP-qPCR. The percentage of the input is shown as indicated. The results showed that the 5hmC enrichment of HIF-1α and ANGPTL4 increased in 10%O2-48 hours and reduced in 1%O2-48 hours. (*p < 0.05, **p < 0.01).