
Figures & data
Table 1. Dataset characteristics.
Table 2. Samples used in the study.
Table 3. Top DMPs.
Figure 1. DNA methylation distinguishes IBD from healthy intestinal epithelial cells.
(a) Top differentially methylated positions (DMPs) with a mean difference between IBD (red) vs. Control (grey) of at least 20% (delta-beta > 20, FDR < 0.05). Probe ID and corresponding nearest gene are shown for each significant CpG site. Methylation is represented on the y-axis as normalized beta values. (b) The same CpG sites shown in (a) are represented separately for ulcerative colitis (UC) and Crohn’s disease (CD), shown in blue and green, respectively. (c) Heatmap showing top differentially methylated positions between IBD vs. control. The red to blue colour gradient represents higher to lower methylation. Main covariates considered in the analysis (i.e., dataset, anatomical location, and sex) are also represented.
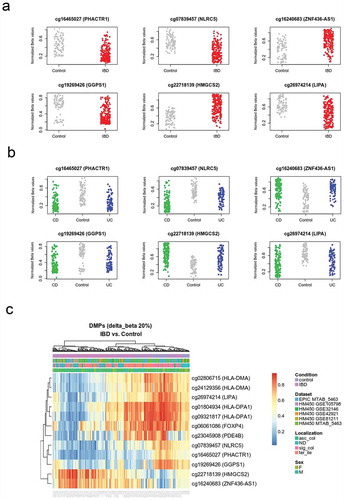
Table 4. Top DMRs.
Figure 2. Mean DNA methylation and variability distinguishes IBD from healthy intestinal epithelial cells.
(a) Top differentially variable methylated CpG sites (DVMCs) in IBD vs. Control. DNA methylation was plotted as beta values for each of the top nine DVMC identified with the iEVORA algorithm (see Methods section). (b) Gene symbols overlapping between site- (DMPs), region (DMRs)-level, and variability (DVMCs) analyses.
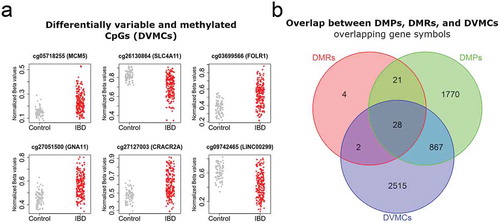
Table 5. Pathway analysis.
Figure 3. Genomic distribution of IBD-related DMPs.
DMPs were annotated according to CpG islands (CGI) (a), relation to gene features (b), and distance to the nearest transcription start site (TSS) (c) For each genomic context, distribution is shown separately for all DMPs, those hypo- or hypermethylated in IBD relative to healthy tissues, and all the HM450 probes, as a control.
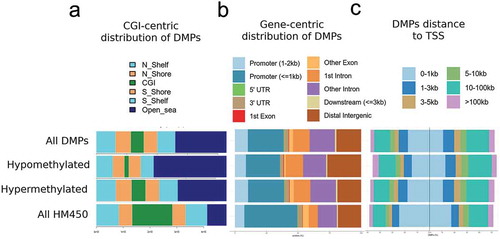
Figure 4. Genomic distances between IBD-related DMPs and known risk SNPs.
Shortest genomic distances were calculated between each IBD-related DMP and the closest IBD-associated polymorphism (SNP). Boxplots represent the distribution of such distances for all DMPs or separately for hyper- or hypo-methylated DMPs. The distance of all HM450 CpG sites was calculated as a control (left boxplot in both panels). The same analysis was performed for all DMPs (right panel) or using only DMPs that did not display a bimodal distribution (left panel), as described in Methods. (*) denotes a significant difference in mean distance relative to control HM450 distances (p < 1e-5).
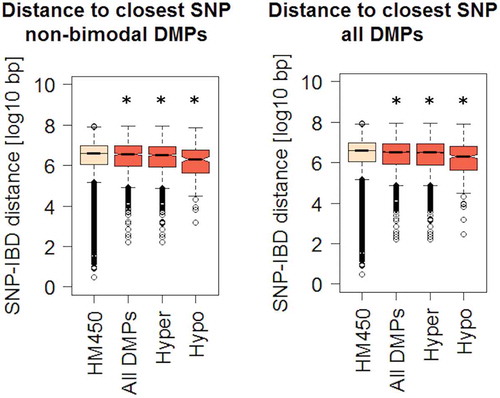
Table 6. IBD DMPs previously identified to be differentially methylated in both CeD duodenal epithelia and immune fractions.
Supplemental material