
Figures & data
Table 1. Differentially methylated positions (DMPs) in the hippocampus of early-stage AD in the 450 K microarray.
Figure 1. Early epigenetic marks of AD validated by bisulphite pyrosequencing results. DNA methylation levels in AD stages vs. control samples at validated CpG sites ELOVL2-cg16867657 (a), GIT1/TP53I13-cg05877788 (b), HIST1H1A-cg07816556 (c) and HIST1H3E/HIST1H3 F- cg13836098 (d). *p-value<0.05; **p-value<0.01; ***p-value <0.001, ****p-value <0.0001. Grey dots: outlier samples.
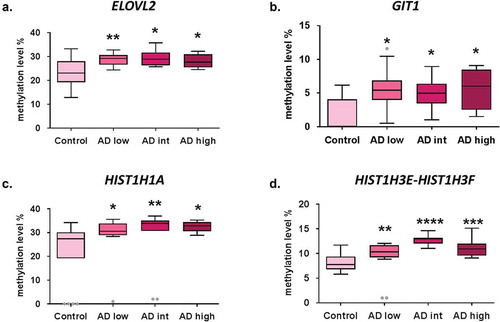
Table 2. Correlation between DNA methylation levels at each validated DMP and tau burden.
Figure 2. Scatter plots graphs of correlation analysis result for DNA methylation levels at each validated DMP and tau burden. Correlation between validated epigenetic marks and p-tau protein burden is graphically showed for ELOVL2 (a), GIT1/TP53I13 (b), HIST1H1A (c) and HIST1H3E/HIST1H3 F (d) genes. A significant positive correlation was found for ELOVL2 [r = 0.350; p-value < 0.05] and HIST1H3E/HIST1H3 F [r = 0.469; p-value < 0.01] genes.
![Figure 2. Scatter plots graphs of correlation analysis result for DNA methylation levels at each validated DMP and tau burden. Correlation between validated epigenetic marks and p-tau protein burden is graphically showed for ELOVL2 (a), GIT1/TP53I13 (b), HIST1H1A (c) and HIST1H3E/HIST1H3 F (d) genes. A significant positive correlation was found for ELOVL2 [r = 0.350; p-value < 0.05] and HIST1H3E/HIST1H3 F [r = 0.469; p-value < 0.01] genes.](/cms/asset/117f60fe-a503-4032-ab8e-5ea2ec2f4ef5/kepi_a_1748917_f0002_b.gif)