Figures & data
Figure 1. Workflow for isolating myonuclei from HSA-GFP mice (a) Example of a manually isolated muscle fibre from the plantaris muscle of a Pax7-tdT mouse that illustrates satellite cells (tdT, red) and adherent mononuclear cells (DAPI, blue) decorating the cell (phalloidin, green). The inset shows a manually dissected muscle fibre from the plantaris muscle of an HSA-GFP mouse where myonuclei fluoresce green (GFP+/DAPI+), and adherent cells are labelled blue (DAPI+/GFP-) (b) Immunohistochemical analysis of a cross-section from an HSA-GFP plantaris showing GFP+ myonuclei (green) within muscle fibre borders (dystrophin, grey), and interstitial non-myonuclei located outside of dystrophin (blue) (c) FACS data from sham and 3-d overload HSA-GFP plantaris muscles (n = 3 per group, *p < 0.05) (d) GFP+ myonuclei from an HSA-GFP plantaris that were mounted on a slide using a Cytospin, co-labelled using DNA stains PI (red) and DAPI (blue), and imaged on a fluorescent microscope (e) DNA quality control analysis showing large-fragment DNA suitable for reduced representation bisulphite sequencing (RRBS)
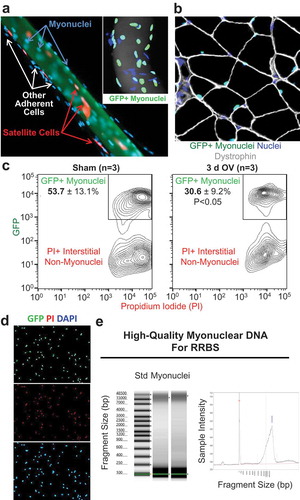
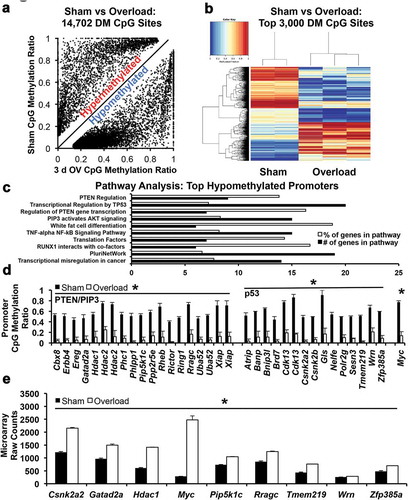
Figure 2. Myonuclear CpG methylation analysis (a) Scatterplot showing all differentially methylated (DM) sites in sham versus 3-d overloaded mice (b) Heatmap showing marked differences in global myonuclear methylation between sham (n = 2) and 3-d overloaded plantaris muscles (n = 3, p < 0.05); blue is hypomethylated and red is hypermethylated (c) Pathway analysis of hypomethylated promoters after 3 d of overload, organized in ascending p-value order from top to bottom (all p < 0.05, top 10 pathways) (d) Promoter CpG methylation levels of genes found in PTEN, PIP3, and p53 pathways, *p < 0.05. Note: Hdac2, Xiap, Uba52, and Cdk13 had two distinct methylation sites (e) Elevated expression of genes in 3-d overloaded C57BL/6J mice that relates to myonuclear CpG methylation of genes in the PTEN, PIP3, and p53 pathways, *p < 0.05