
Figures & data
Figure 1. Effects of covariate inclusion on test-statistic inflation. quantile-quantile (QQ) plots for the outcomes postpartum depression case status (a) and age (b). Each colour denotes a different level of quality control used in association testing: no covariates (red), commonly used pipeline (green), and our proposed iterative quality control process (blue)
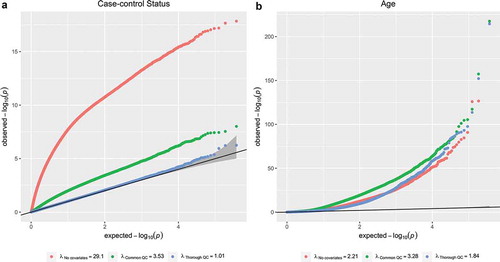
Table 1. GEO Datasets included in systematic review
Supplemental material