Figures & data
Table 1. Clinicopathological characteristics of CRC patients from TCGA database
Figure 1. Identification of six candidate CpGs in the training cohort. (a) Unsupervised hierarchical clustering and heatmap for 249 CRC patients based on 3299 CpGs associated with OS. Each column corresponds to an individual patient and each row corresponds to an individual CpG. (b) Kaplan-Meier survival curves of the two groups generated by the clustering. (c) Kaplan-Meier survival curves of the two groups generated by the supervised hierarchical clustering in the test cohort. (d) Ten-fold cross-validation for regularized cox regression with L1 penalty identified six candidate CpGs. The two dotted vertical lines are drawn at the optimal values by minimum criteria and 1-standard error criteria, respectively. The tuning parameter λ = 0.057 with log (λ) = −2.863 was determined by minimum criteria. (e) Correlations among the methylation levels of the six CpGs
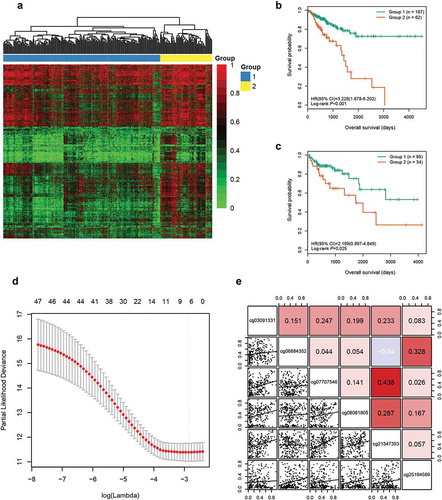
Table 2. Characteristics of six CpG markers in the methylation signature
Figure 2. Risk score distribution and survival analysis of the six-CpG signature in training and test cohorts. The distribution of risk score, survival status, and CpG methylation level for patients in training cohort (a) and test cohort (c). Kaplan–Meier survival curves of the OS and PFS of patients using the six-CpG signature in training cohort (b) and test cohort (d)
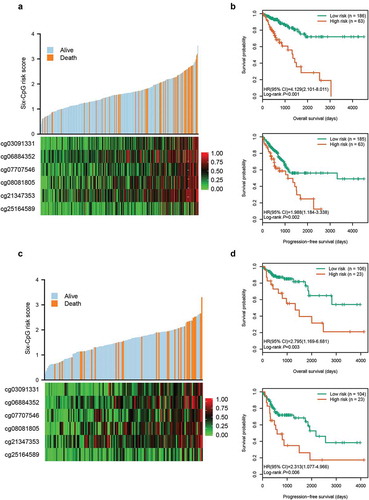
Figure 3. Correlations among CpG methylation, gene expression, and OS. (a–f) Kaplan‐Meier survival curves of six CpGs in 378 CRC patients. (g) Kaplan‐Meier survival curves of NPY2R gene in 580 CRC patients. The optimal cut-off was determined by the X-tile plots. Colouration of the plot represents the strength of the association at each division, ranging from low (dark, black) to high (green or red). Red represents the inverse association between the risk score and OS, whereas green represents a direct association. The dark dots in the X-tile plots are the cut-off points based on the highest χ2-value with Kaplan–Meier survival analysis. Hyper: Hypermethylation; Hypo: Hypomethylation; HE: High expression; LE: Low expression
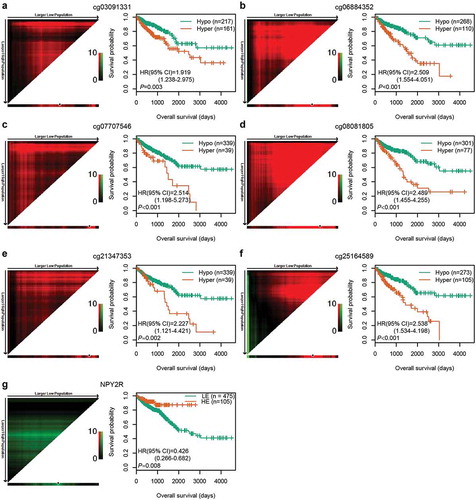
Figure 4. GSEA analysis between the high- and low-risk groups in the entire cohort. Enrichment plots of representative gene sets in the high-risk group (FDR < 0.01)
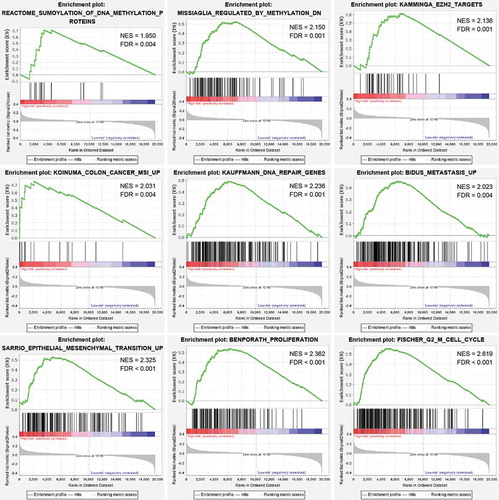
Figure 5. ROC curves of the six-CpG signature and other prognostic methylation markers in test cohort for predicting OS at 3 years (a) and 5 years (b). aJia et al. reported seven CpGs as prognostic markers in CRC. Five of them had methylation values in TCGA-COAD and TCGA-READ datasets. bGündert et al. reported 20 CpGs as prognostic markers in CRC. Nineteen of them had methylation values in TCGA-COAD and TCGA-READ datasets
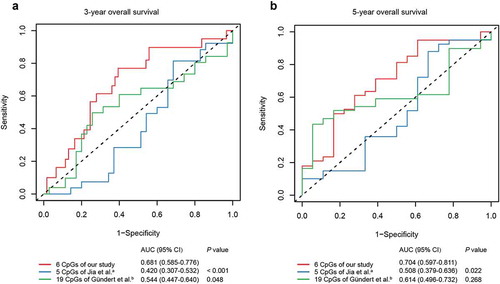
Table 3. Univariate and multivariate Cox regression analyses of clinicopathological characteristics and six-CpG signature in the entire cohort
Figure 6. Subgroup analysis of the six-CpG signature in the entire cohort. (a) The results of Kaplan–Meier survival analysis of the six-CpG signature in different subgroups stratified by clinicopathological characteristics. Kaplan–Meier survival curves of the six-CpG signature in patients with different TNM stage, including stage I/II (b) and stage III/IV (c)
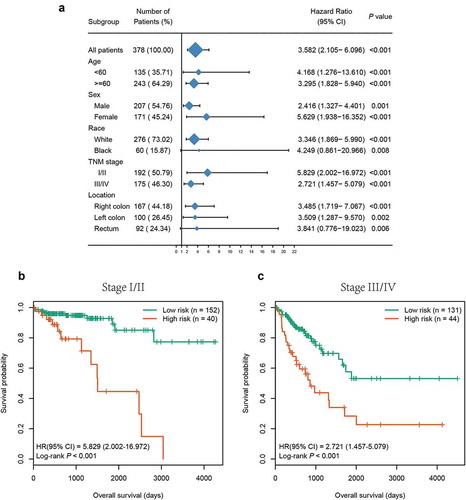
Figure 7. Construction and validation of the prognostic nomogram. (a) Nomogram for predicting the 3-year and 5-year OS of patients with CRC. Kaplan‐Meier curves of three subgroups stratified by the total points of the nomogram in training cohort (b) and test cohort (d). The calibration curves for predicting the 3-year and 5-year OS in the training cohort (c) and test cohort (e)
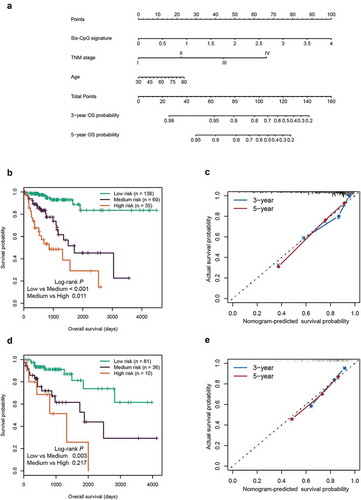
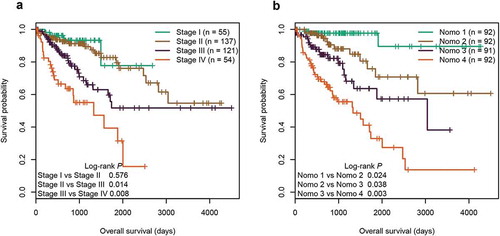
Figure 8. Kaplan‐Meier survival curves of four subgroups stratified by TNM staging system (a) or the total points of the nomogram (b) in the entire cohort