Figures & data
Figure 1. Global levels of 5hmC and 5mC in TET1 KO blastocysts. (a) Strategy to disrupt TET1 gene in porcine embryos. Three sgRNAs target different regions of TET1 gene; one on the immediate downstream of the presumable translation start site and two on the 5′ side of the 2-oxoglutarate-Fe(II)-oxygenase domain. (b) Global 5hmC level of blastocysts was dramatically decreased by TET1 KO. (c) Difference of global 5mC level between TET1 KO and control blastocysts was not detected by immune-staining. Numbers in parentheses indicate the number of embryos displaying a positive signal for 5hmC or 5mC out of the total number of embryos examined. (d) Bisulphite sequencing analysis of DNA methylation pattern in repetitive elements. Methylation level of PRE-1 was increased by TET1 KO whereas centromeric satellites were hypomethylated in both TET1 KO (n = 17) and control blastocysts (n = 17). Scale bar indicates 100 µm. Methylated and unmethylated CpG dinucleotides are indicated by filled circle and open circle, respectively
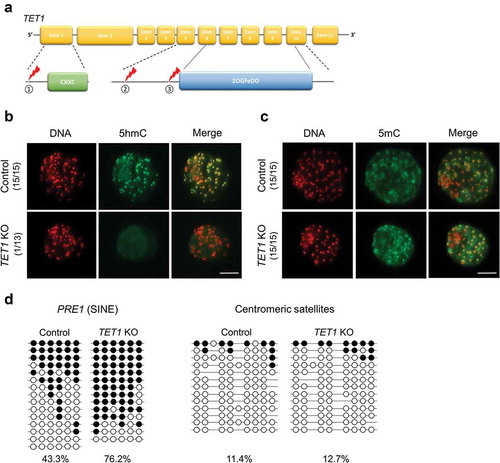
Figure 2. Impact of TET1 KO on gene expression profile and lineage specification in blastocysts. (a) Expression levels of NANOG and ESRRB were increased by TET1 KO; however, levels of other pluripotency genes were not significantly changed. (b) Transcript levels of extra-embryonic lineage genes were not changed by TET1 KO, except GATA4. (c) The level of TET1 transcript was decreased; however, TET3 levels were increased approximately threefold. Relative expression levels were normalized to GAPDH level. Error bars represent SEM. A p-value < 0.05 was considered statistically significant. (d) CDX2 staining revealed that TET1 KO did not alter lineage commitment in blastocysts. The dotted white circle indicates ICM lineage. Scale bar indicates 100 µm. (e) ICM/TE cell number ratio was calculated by counting CDX2 negative and CDX2 positive cells. The ICM/trophectoderm ratio was not different between control and TET1 KO blastocysts. Error bars indicate SD. A p-value < 0.05 was considered statistically significant. TE: Trophectoderm
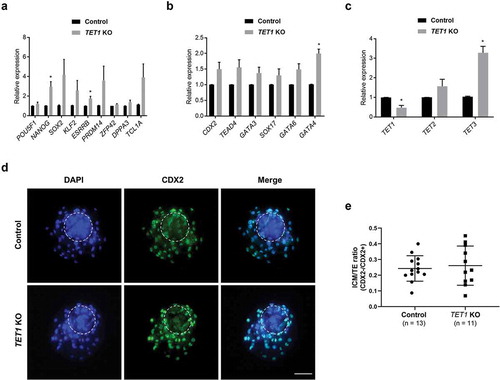
Figure 3. Global levels of 5hmC and 5mC in DMOG-treated blastocysts. (a) Timeline of DMOG treatment to inhibit TET activities in blastocysts. To block TET activities at blastocyst stage, embryos were incubated with 1 mM DMOG from morula stage (d 4) to blastocyst stage (d 7); then, blastocysts were collected for further analysis. (b) Global 5hmC level of blastocysts was dramatically decreased by DMOG treatment. (c) Difference of global 5mC level between DMOG-treated and control blastocysts was not detected by immunocytochemistry. Numbers in parentheses indicate the number of embryos displaying a positive signal for 5hmC or 5mC out of the total number of embryos examined. (d) Bisulphite sequencing analysis of DNA methylation pattern in repetitive elements. Methylation level of PRE-1 was increased by DMOG treatment whereas centromeric satellites were hypomethylated in both DMOG-treated (n = 15) and control blastocysts (n = 16). Scale bar indicates 100 µm. Methylated and unmethylated CpG dinucleotides are indicated by filled circle and open circle, respectively
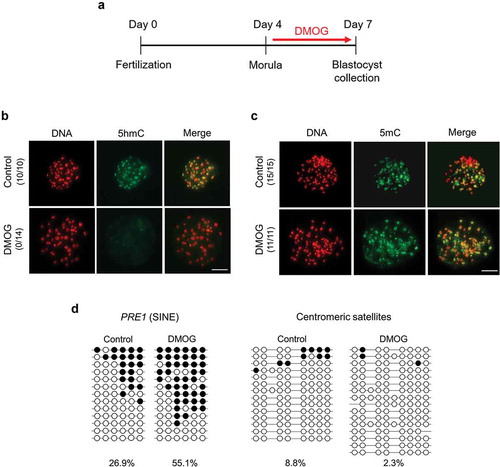
Figure 4. Relative mRNA levels of pluripotency genes, extra-embryonic lineage genes, and TET family genes in DMOG-treated blastocysts. (a) Expression levels of pluripotency genes were downregulated in DMOG-treated blastocysts, except for SOX2, KLF2, and TCL1A. (b) Transcript levels of extra-embryonic lineage genes were reduced in DMOG-treated blastocysts. (c) Expression level of TET family genes was reduced in DMOG-treated blastocysts. Relative expression levels were normalized to GAPDH level. Error bars represent SEM. A p-value < 0.05 was considered statistically significant. (d) The number of CDX2 negative cells (ICM) was reduced in DMOG-treated blastocysts compared to that in control blastocysts. The dotted white circle indicates ICM lineage. Scale bar indicates 100 µm. (e) DMOG treatment lowered ICM/TE ratio. Error bars indicate SD. A p-value < 0.05 was considered statistically significant. TE: Trophectoderm
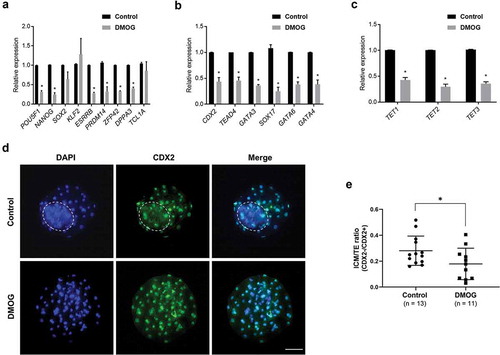
Figure 5. DNA methylation (5hmC and 5mC) status of NANOG gene in TET1 KO and DMOG-treated blastocysts. (a) Analysis of methylation status of porcine NANOG gene. The proximal promoter region (1291 bp upstream the TSS) and gene-body region (1159 bp downstream the TSS) of NANOG gene were separately examined. (b) 5hmC level in promoter and gene-body regions of NANOG gene in TET1 KO blastocysts. (c) Bisulphite sequencing analysis of promoter and gene-body regions of NANOG gene in TET1 KO (n = 15) and control (n = 15) blastocysts. (d) 5hmC level in promoter and gene-body regions of NANOG gene in DMOG-treated blastocysts. (e) Bisulphite sequencing analysis of promoter and gene-body regions of NANOG gene in DMOG-treated (n = 15) and control (n = 15) blastocysts. 5hmC data were analysed with Student’s t-test for three replicates and a p-value < 0.05 was considered statistically significant
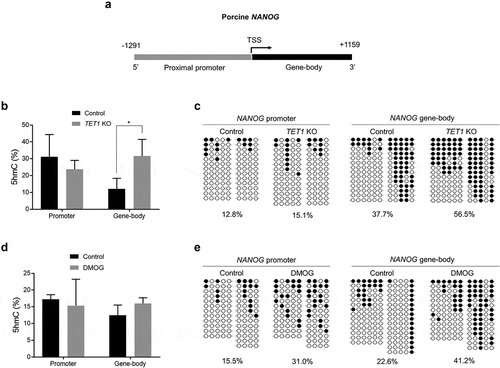
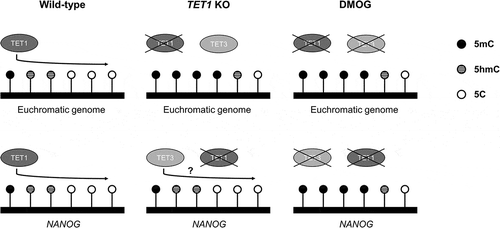
Figure 6. Graphical summary and proposed mechanism of TET actions on DNA methylation in porcine blastocysts under the TET1 KO or TET inhibition