
Figures & data
Table 1. General information regarding the human cancer organoids used in the DNA methylation study
Figure 1. Cancer organoid DNA methylation landscapes retain the original tumour type epigenetic profile. (a and c) Heatmaps demonstrating unsupervised hierarchical clustering with bootstrap resampling of DNA methylation profiles for all organoid samples using (a) Infinium MethylationEPIC BeadChip (EPIC) (>850,000 CpGs) and (c) Infinium HumanMethylation450 BeadChip (450 K) (>450,000 CpGs). Red represents methylated CpGs, green unmethylated CpGs. (b and d) t-SNE plots further highlight organoid clustering based on their DNA methylation characteristics from EPIC (b) and 450 K (d). Each organoid sample is labelled according to its respective ATCC ID (b and d). Organoid DNA methylation profiles are displayed as brown (colorectal cancer), violet (oesophageal cancer), light blue (lung cancer), dark blue (pancreatic cancer), and yellow (stomach cancer)
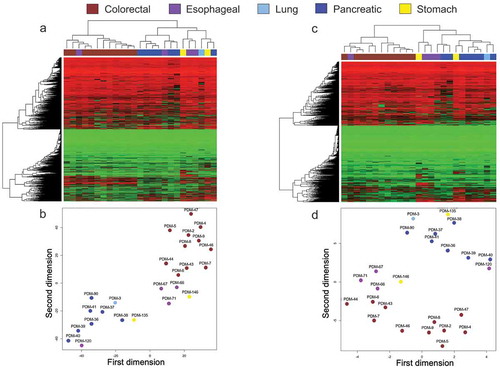
Figure 2. Cancer organoid DNA methylation profiles are distinct to their healthy tissue counterparts according to unsupervised hierarchical clustering. (a–e) Heatmaps showing unsupervised hierarchical clustering with bootstrap resampling DNA methylation clustering of each cancer organoid against its healthy tissue equivalent. All healthy samples are represented in light grey and are pertinent to the organoid cell type. For example, the heatmap represented in Figure 2a, light grey represents normal colorectal tissue methylation, in Figure 2b, light grey represents methylation clustering in healthy oesophageal cells, etc. In all heatmaps, red represents methylated CpGs, green unmethylated CpGs, and black. Organoid DNA methylation profiles are displayed by cancer types: brown (colorectal cancer), violet (oesophageal cancer), light blue (lung cancer), dark blue (pancreatic cancer), yellow (stomach cancer), and light grey (corresponding normal tissue). All interrogated CpGs were analysed using only EPIC and 450 K shared probes
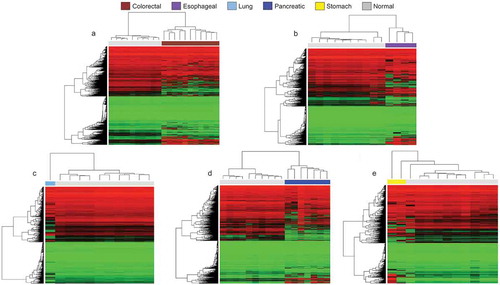
Figure 3. Cancer organoid DNA methylation profiles are distinct to their healthy tissue counterparts according to t-SNE. (a–e) t-SNE of cancer organoid DNA methylation vs its normal tissue counterpart and each organoid sample is labelled according to its respective ATCC ID. Organoid DNA methylation profiles are displayed by cancer types: brown (colorectal cancer), violet (oesophageal cancer), light blue (lung cancer), dark blue (pancreatic cancer), yellow (stomach cancer), and green (corresponding normal tissue). All interrogated CpGs were analysed using only EPIC and 450 K shared probes
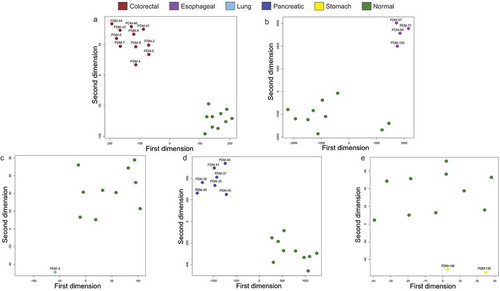
Figure 4. DNA methylation profiles from colorectal and pancreatic cancer organoids in the context of primary tumours and cancer cell lines. Heatmaps representing unsupervised hierarchical clustering with bootstrap resampling of DNA methylation in colorectal (a) and pancreatic (b) cancer organoid samples and their primary tumour [The Cancer Genome Atlas or (TCGA)] and cancer cell line [Wellcome Sanger Institute (Sanger)] counterparts. Red represents methylated CpGs, green unmethylated CpGs. (c and d) t-SNE plots show organoid, primary tumours and cancer cell lines clustering based on their DNA methylation profiles representing (c) colorectal cancer and (d), pancreatic cancer. Each organoid sample is labelled according to its respective ATCC ID. (a – d) DNA methylation profiles are displayed as cancer types and tissues; brown (organoid colorectal cancer), dark blue (organoid pancreatic cancer), primary tumour (black) and cancer cell lines (dark grey). The primary tumours and cancer cell lines are respective of the organoid tissue in each figure. All CpGs were analysed using only EPIC and 450 K shared probes
![Figure 4. DNA methylation profiles from colorectal and pancreatic cancer organoids in the context of primary tumours and cancer cell lines. Heatmaps representing unsupervised hierarchical clustering with bootstrap resampling of DNA methylation in colorectal (a) and pancreatic (b) cancer organoid samples and their primary tumour [The Cancer Genome Atlas or (TCGA)] and cancer cell line [Wellcome Sanger Institute (Sanger)] counterparts. Red represents methylated CpGs, green unmethylated CpGs. (c and d) t-SNE plots show organoid, primary tumours and cancer cell lines clustering based on their DNA methylation profiles representing (c) colorectal cancer and (d), pancreatic cancer. Each organoid sample is labelled according to its respective ATCC ID. (a – d) DNA methylation profiles are displayed as cancer types and tissues; brown (organoid colorectal cancer), dark blue (organoid pancreatic cancer), primary tumour (black) and cancer cell lines (dark grey). The primary tumours and cancer cell lines are respective of the organoid tissue in each figure. All CpGs were analysed using only EPIC and 450 K shared probes](/cms/asset/e4444a01-3a99-4a7a-8242-a9a92520ff82/kepi_a_1762398_f0004_c.jpg)
Figure 5. DNA methylation profiles of oesophageal, lung, and stomach cancer cluster predominately with primary tumours according to unsupervised hierarchical clustering. (a – c) Heatmaps demonstrating unsupervised hierarchical clustering with bootstrap resampling of oesophageal cancer organoids, oesophageal primary tumours (TCGA), and oesophageal cancer cell lines (Sanger) (a), lung (b) and stomach (c) DNA methylation. Red represents methylated CpGs, green unmethylated CpGs. Organoids are represented in violet (oesophageal cancer), light blue (lung cancer), and yellow (stomach cancer). In black, all pertinent primary tumours and dark grey, the respective cancer cell lines. All CpGs were examined using only EPIC and 450 K shared probes
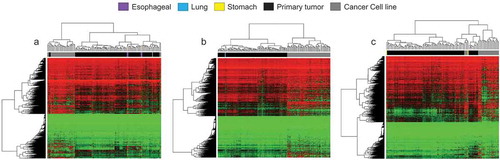
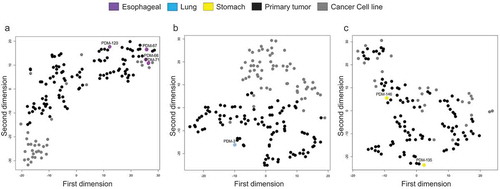
Figure 6. DNA methylation profiles of oesophageal, lung, and stomach cancer cluster predominately with primary tumours according to t-SNE. (a–c) t-SNE plots of oesophageal organoid DNA methylation visualization (a), lung (b) and stomach (c) with primary tumour (TCGA) and cancer cell line (Sanger) equivalents. Organoids are represented in violet (oesophageal cancer), light blue (lung cancer), and yellow (stomach cancer). In black, all pertinent primary tumours and dark grey, the respective cancer cell lines. All CpGs were examined using only EPIC and 450 K shared probes
Data availability
The complete DNA methylation data are freely available on the GEO repository under accession number GSE144213:
https://www.ncbi.nlm.nih.gov/geo/query/acc.cgi?acc=GSE144213