Figures & data
Figure 1. Lhx1 transcription is controlled by DNMT1, but not through its DNA methylation activity
(a) Schematic illustration of a mouse brain coronal section at embryonic day (E) 16 depicting Hmx3- (red) and Lhx1-positive (green) cells located in the preoptic area. (b) Quantitative Real-Time PCR displays Lhx1 expression in FACS-enriched Hmx3-Cre/tdTomato/Dnmt1 loxP2 cells (Dnmt1 KO) compared to Hmx3-Cre/tdTomato/Dnmt1 wild-type cells (Dnmt1 WT) of E16 mice. (c) MeDIP sequencing analysis of the Lhx1 gene locus of Dnmt1 WT and Dnmt1 KO mice. (d)Quantitative Real-Time PCR displays the Lhx1 expression in N2a cells treated either with Dnmt1 siRNA or RG108 in comparison to control siRNA- or DMSO-treated N2a cells. (e) Scatter Plot of genes indicating changes in their methylation and expression levels between Hmx3-Cre/tdTomato/Dnmt1 loxP2 cells and Hmx3-Cre/tdTomato/Dnmt1 wild-type cells of E16 mice. *P < 0.05; ***P < 0.001; Student’s t-test. Ctrl, control; ctx, cortex; LGE, lateral ganglionic eminence (GE); MGE, medial GE; POA, preoptic area; RNE, relative normalized expression.
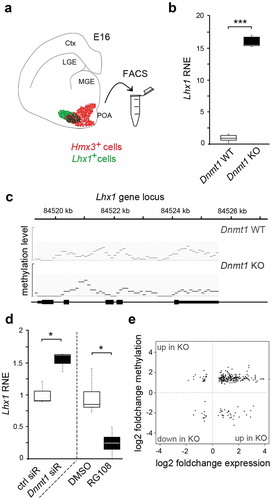
Figure 2. DNMT1-dependent modulation of repressive and permissive histone lysine trimethylation contributes to Lhx1 expression control
(a) Quantitative Real-Time PCR shows Lhx1 expression in N2a cells treated either with DZNep or DMSO as control. (b, c) Life cell imaging analysis of migrating N2a cells treated with DZNep and DMSO as control. Representative brightfield images of temporal sequences illustrating N2a cells and their migratory behaviour after treatment with DMSO (b) or DZNep (c) depicting frames at 0 h, 2.5 h, and 5 h. The white arrowhead points to the soma of the monitored cell. The last panel in (b) and (c) represents the colour-coded migratory distances within the analysed 5 h (temporal LUT), indicating the starting point (deep blue) and end (white) of the respective cell. (d) Quantification of migration speed of DMSO- and DZNep-treated N2a cells (in µm/h; n = 30 cells for each condition in three independent experiments). (e, f) Representative microphotographs of N2a (e) and POA cells (f) treated with DZNep (N2a cells n = 93; POA n = 69) in comparison to DMSO control (N2a cells n = 85; POA n = 52) with F-actin stained using phalloidin (green) and nucleus staining (DAPI, blue). The number of processes from cell soma and of branches from the longest process is shown in (g). (h) Schematic illustration according to UCSC genome browser displaying the Lhx1 gene locus with promoter (red), promoter flanking (light red), and non-regulatory (white) sites. DNA primer positions (#1, #2, #3) for quantitative PCR are indicated with blue bars. (i–l) Targeted ChIP analysis showing the association of H3K4me3 (i, j) and H3K27me3 (k, l) to the primer positions #1–#3 at the Lhx1 gene locus of N2a cells, treated with Dnmt1 siRNA in comparison to control siRNA, and analysed by quantitative Real-Time PCR and normalized to input controls. The amount of non-specifically bound DNA is indicated to IgG controls. Scale bar: 50 µm in (b) and (c), 10 µm in (e) and (f). *P < 0.05; ***P < 0.001; Student’s t-test. BF: brightfield, Ctrl, control; Phallo, phalloidin., temp. LUT: temporal LUT; RNE, relative normalized expression.
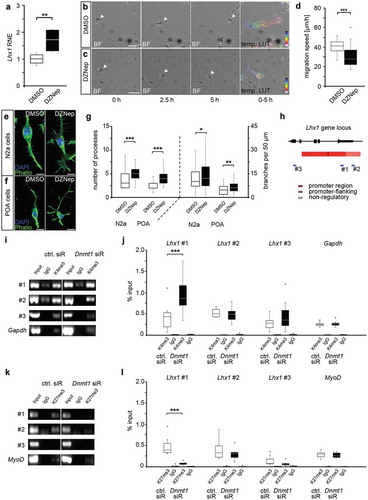
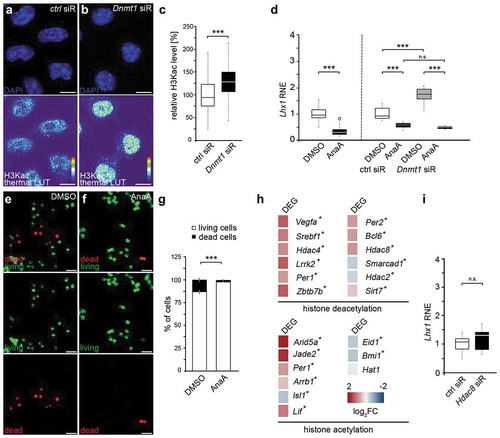
Figure 3. Lhx1 transcription is modulated by DNMT1-dependent histone acetylation and deacetylation processes
(a–c) Representative microphotograph of control (a) and Dnmt1 siRNA-treated (b) N2a cells stained for H3K9/14/18/23/27ac, shown as thermal colour code indicating fluorescence intensity (thermal LUT) and nucleus staining (DAPI). The mean grey value is analysed and normalized to control siRNA (c, n = 540 cells for each condition). (d) Lhx1 expression levels in N2a cells treated either with DMSO, anacardic acid (left), control siRNA and DMSO together, control siRNA and anacardic acid in combination, Dnmt1 siRNA in combination with DMSO and Dnmt1 siRNA together with anacardic acid (right). Student’s t-test was applied for the comparison shown in the left part of the diagram. Two-way ANOVA and Tukey Test were performed for the analysis depicted in the right part of the diagram. The two-way ANOVA revealed that the siRNA conditions, the (inhibitor) treatment conditions as well as the combination of both were highly significant (***P < 0.001). The significances resulting from the post-hoc Tukey Test are indicated in the diagram. (e–g) Representative microphotographs of N2a cells treated with DMSO or anacardic acid and stained for living (green) and dead cells (red) analysed as percentage of total cell number (g). (h) Heat-map of differential expression levels for genes associated with GO terms histone deacetylation and acetylation in FAC-sorted E16 control and Dnmt1-deficient POA cells revealed by RNA sequencing (*DEG with p < 0.05, Bonferroni-corrected). (i) Lhx1 expression in Hdac8 siRNA-treated N2a cells compared to control cells (g) and Scale bar: 10 µm in (a) and (b), 40 µm in (e) and (f). ***P < 0.001; Student’s t-test. AnaA, anacardic acid; Ctrl, control; RNE, relative normalized expression.