
Figures & data
Figure 1. DNA methylation profiling of tissue samples in the initial cohort. (a) Principal component analysis based on the results of the Infinium assay. The DNA methylation profile of non-cancerous urothelium (N, n = 31, blue) from patients with upper urinary tract urothelial carcinoma (UTUC) tended to differ from that of normal control urothelium (C, n = 26, black). Furthermore, the DNA methylation profile of the corresponding UTUC (n = 31, red) clearly differed from those of both C and N samples. (b) Unsupervised hierarchical clustering (Ward’s linkage using Euclidean distances). The distinct difference of the DNA methylation profile of UTUC (red) from that of C (black) or N (blue) samples is again confirmed. (c) Representative results of receiver operating characteristic curve analysis for candidate marker CpG sites identified using the procedures described in the Results section. The area under the curve values for Infinium probes cg01921432 and cg07418387 for discrimination of UTUC from C and those of the same probes for discrimination of UTUC from N are all 1
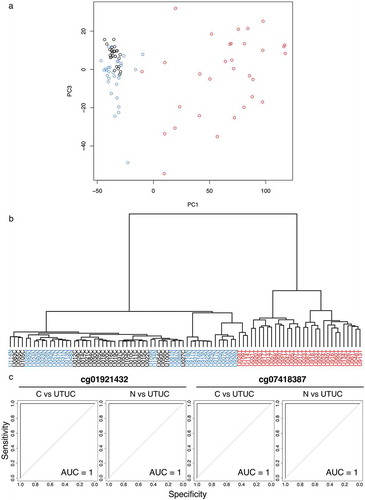
Table 1. DNA methylation levels obtained by Infinium assay for tissue samples of normal control urothelium (C), non-cancerous urothelium (N) from patients with upper urinary tract urothelial carcinoma (UTUC), and the corresponding UTUCs in the initial cohort and urinary bladder urothelial carcinoma (BUC)
Table 2. Marker CpG sites discriminating urinary tract urothelial carcinoma (UTUC) from normal control urothelium (C), non-cancerous urothelium from patients with UTUC (N), and urinary bladder urothelial carcinoma (BUC) located within stably regulated CpG islands or their shores and shelves, and for which DNA methylation levels based on Infinium assay were technically verified using pyrosequencing
Figure 2. DNA methylation levels obtained by pyrosequencing of candidate marker CpG sites in tissue samples in the initial cohort. Normal control urothelium (C, n = 26), non-cancerous urothelium (N, n = 31) obtained from patients with upper urinary tract urothelial carcinoma (UTUC), and the corresponding UTUC (n = 30) were analysed. Infinium probe IDs and P values in Welch’s t-test are shown in each panel. DNA methylation levels for each of the Infinium probes cg01921432, cg07197785, cg08364561, cg15822765, and cg24035245 in UTUC samples are significantly higher than those in both C and N samples. The DNA methylation levels for each of the Infinium probes cg07418387, cg10256242, cg10874111, cg14302471, and cg14851578 in UTUC samples are significantly lower than those in both C and N samples
Table 3. DNA methylation diagnosis of upper urinary tract urothelial carcinoma (UTUC)