Figures & data
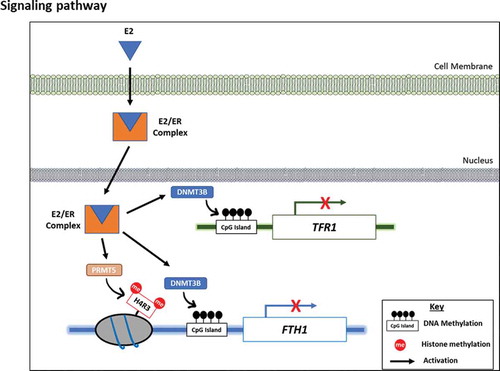
Figure 1. Expression patterns of FTH1 and TFRC genes in Estrogen (E2)-treated cancer cell lines. Hep-G2 cells treated with E2 for (a) different periods of time or (b) at different concentrations were assessed for the mRNA levels of FTH1 and TFRC by RT-PCR. (c) Lysates from Hep-G2 cells treated with 5, 10 or 20 nM E2 for 6 hours were assessed for FTH1 and TFR1 proteins expression by western blotting. Similarly, effect of E2 treatment on FTH1 and TFRC/TFR1 expression were analysed in (d, e) Huh7, (f) MCF7 and (g) AGS cell lines. Actin was used for normalization and as a loading control for western blotting. Only one representative figure, out of at least two independent experiments, is shown. In each bar graph, the data represent means ± SEM. *P < 0.01, and **P < 0.001 compared with control
Figure 2. DNA methylation patterns of FTH1 and TFRC genes in Estrogen (E2)-treated cancer cell lines. (a) Quantitative Methylation-specific polymerase chain reaction (qMSP) was used to assess DNA methylation in Hep-G2 cells following treatment with 20 nM E2 for 6, 12, 24 and 48 hours. (b, c) FTH1 and TFRC mRNA levels and DNA methylation status were assessed in Hep-G2 cells treated with 20 nM E2 (E20) alone, 1.0 µM 5-Aza-2-deoxycytidine (Aza) alone, Aza followed by E2 (A->E) or E2 followed by Aza (E->A). Similarly, the effect of E2 treatment on FTH1 and TFRC promoter methylation was analysed in (d) Huh7 cell lines. Further, the effect of demethylation treatment was assessed in (e) MCF7 and (f) AGS cell lines. In each bar graph, the data represent means ± SEM. *P < 0.01, and **P < 0.001 compared with control; NS represents ‘not significant’
Figure 3. E2-induces DNA methylation through the activity of DNMT3B. (a, b) Lysates from Hep-G2 cells treated with 5, 10 or 20 nM E2 for 6 hours were assessed for DNMT1, DNMT3A and DNMT3B proteins by western blotting. The expression of all three proteins was also assessed in untreated MCF7 cells as external control. (c) Flow cytometry-based measurement of DNMT1 and DNMT3B proteins in Hep-G2 cells treated with 20 nM E2 alone, 1.0 µM 5-Aza-2-deoxycytidine (Aza) alone, Aza followed by E2 (A->E) or E2 followed by Aza (E->A). Only one representative figure, out of at least two independent experiments is presented. Relative protein expression was calculated and plotted as bar graph. Actin was used for normalization and as a loading control. In each bar graph, the data represent means ± SEM. *P < 0.01, and **P < 0.001 compared with control
Figure 4. PRMT5-dependent methylation of H4 (H4R3me2s) regulates FTH1 gene expression. (a) Lysates from Hep-G2 cells treated with 5, 10 or 20 nM E2 for 6 or 12 hours were assessed for H4R3me2s, and PRMT5 proteins; Actin was used as a loading control. Enrichment for (b) FTH1 gene and (c) TFRC gene fragments isolated by anti-H4R3me2s or anti-PRMT5 antibodies was assessed by qPCR and expressed as fold-change relative to the respective control. ChIP assay showing the interaction of H4R3me2s and PRMT5 proteins with (d) FTH1 gene and (e) TFRC gene fragments obtained from E2-treated and control Hep-G2 cells; isotype-matched negative antibody (IgG) is shown to left of each set, formaldehyde was used for crosslinking. Only one representative figure, out of at least two independent experiments is shown. In each bar graph, the data represent means ± SEM. *P < 0.01, and **P < 0.001 compared with control. (C: control, V: vehicle, and E2: Estrogen)
Figure 5. Differential E2-induced methylation events are required for FTH1 and TFRC silencing. (a) Expression status of H4R3me2s, total H4 and PRMT5 proteins in lysates obtained from E2-treated PRMT5-silenced Hep-G2 cells as well as treatment and silencing negative controls. (b) Expression status of FTH1, TFR1, DNMT3B and PRMT5 proteins in lysates obtained from E2-treated PRMT5 and/or DNMT3B-silenced Hep-G2 cells as well as treatment and silencing negative controls. (c) Next, these siRNAs treated cells were used to analyse DNA methylation of the promoter region of FTH1 and TFRC genes by qMSP. Only one representative figure, out of at least two independent experiments is shown. Actin was used for normalization and as a loading control. In each bar graph, the data represent means ± SEM. **P < 0.001 compared with E2 treatment. (C: control, V: vehicle, and E2: Estrogen)
Figure 6. E2/ER agonist-induces Estrogen-receptor alpha (ERα)-mediated DNA and histone methylation silencing of FTH1 and TFR1. (a) Protein expression status of ERα and ER-beta (ERβ) upon E2-treatment was assessed by western blotting. (b) Expression and nuclear translocation of ERα and ERβ in Hep-G2 cells treated with E2 (20 nM, 6 hours) were assessed by immunofluorescence microscopy. ERα/β were labelled with Alexafluor®488 (Green), Actin was labelled with Alexafluor®680 (Red) to show the cytoplasm and nucleus was labelled with DAPI (Blue). Images were taken at 100X magnification; scale bar represents 20 µm (white bar). (c) Expression status of FTH1, TFR1, H4R3me2s, total H4 and DNMT3B in Hep-G2 cells treated with E2 (20 nM), ICI (10 µM) and PPT (1 µM), alone or in combination, all for 6 hours. (d) Expression status of FTH1, TFR1, H4R3me2, total H4, and DNMT3B in ERα-silenced (siERα) Hep-G2 cells treated with E2 (20 nM), ICI (10 µM) and PPT (1 µM) for 6 hours. Only one representative figure, out of at least two independent experiments is shown. For western blotting images, the densitometry ratio was calculated to show quantitative protein expression relative to control. Actin was used for normalization and as a loading control
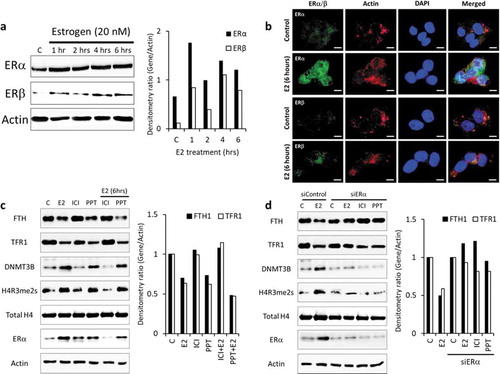
Figure 7. The silencing of FTH1 and/or TFRC disrupts intracellular iron metabolism and induces adverse consequences in Hep-G2 cells. (a) Expression status of FTH1, TFR1 proteins in lysates obtained from Hep-G2 cells transfected with 15 or 30 pmol of siRNA against FTH1 and/or TFRC genes. Cells were harvested and lysates were prepared at 48 hours’ post-transfection. Data shown are representative of at least two separate experiments; Actin was used as a loading control. (b) Labile iron content in FTH1- and/or TFRC-silenced Hep-G2 cells using the CA-AM/CA-AM+DFO-staining based flow cytometry and expressed as %∆MFI as explained in the methods section. (c) Cell cycle phase distribution in FTH1- and/or TFRC-silenced Hep-G2 cells; transfection control cells were analysed for comparison. (d) Mean ± SD of percentage apoptosis in FTH1- and/or TFRC-silenced Hep-G2 cells as compared with controls at 48 hours’ post-transfection based on two separate experiments. (e) Cell growth in FTH1- and/or TFRC-silenced Hep-G2 cells as observed by Bright filed microscopy imaging at 72 hours’ post-transfection. Images were taken at a 20X magnification. (f) Mean ± SD of percentage cell growth in FTH1- and/or TFRC-silenced Hep-G2 cells at 24, 48 and 72 hours of post-transfection. For each experiment, E2 (20 nM) treated Hep-G2 cells were used to compare its effect on labile iron, cell cycle arrest, apoptosis, and cell growth. Data shown are representative of at least two separate experiments. *P < 0.01, and **P < 0.001 compared with siControl
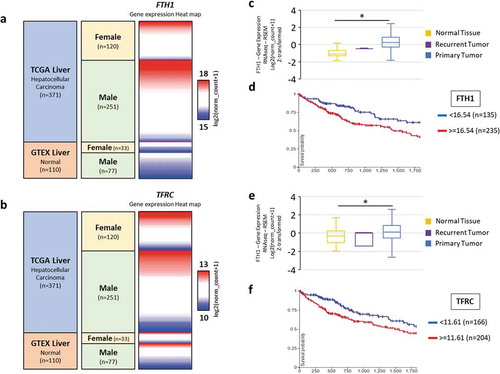
Figure 8. Expression of FTH1 and TFRC gene in human liver tissue. A total of 481 cases (110 normal livers and 371 Hepatocellular carcinomas including 2 recurrent tumours and 369 primary liver tumour) from GTEX and TCGA datasets were included in this analysis. (a, b) Heat maps showing datasets, sample types, gender demographics and gene expression profile across those tissue samples. Red and blue colours represent high and low expression, respectively. (c-f) Boxplots were generated to compare the gene expression in normal versus tumour samples and Kaplan-Meier (KM) survival plot was generated for both the genes to analyse overall survival in these patients with a 5-years follow-up threshold. (c) FTH1: Z-score of normal liver tissue: −1.14 vs primary liver tumour: 0.245 (*p < 0.0001). (e) TFRC: Z-score of normal liver tissue: −0.286 vs primary liver tumour: 0.123 (*p < 0.0001). (Figures were generated by analysis of the datasets using UCSC Xena browser)