Figures & data
Figure 1. Epigenetic age of MCC cells is significantly younger compared to the chronological age of MCC patients
In (a), a scatter plot of 14 Merkel cell carcinoma (MCC) illustrates that there is no significant correlation between chronological age and DNAmAge (Pearson’s correlation coefficient of 0.05). The solid blue line corresponds to DNAmAge = chronological age. In (b), boxplots illustrate that the MCC DNA methylation age (DNAmAge) is significantly (***p-value <0.0001) younger compared to the chronological age. The DNAmAge is irrespective of the presence of the Merkel cell polyomavirus (MCPyV) (MCPyV-negative MCCs marked red). In (c), the chronological age and the DNAmAge of the MCC cell line MKL-1, MKL-2, WaGa, and MCC13 were plotted. The MCC cell lines WaGa and MCC13 are epigenetically ‘younger’ compared to their chronological age.
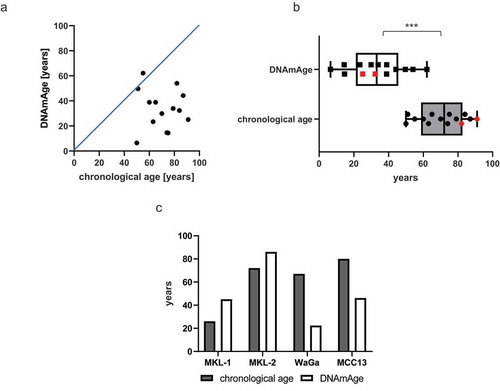
Table 1. Summary of the clinicopathological data of the MCC patients and tissues including DNAmAge
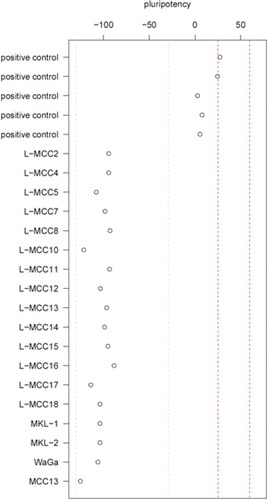
Figure 2. MCCs are not pluripotent
The pluripotency score on the y-axis illustrates in as much the samples on the x-axis are pluripotent according to the PluriTest. The red lines mark the region of pluripotency, in which only the positive controls (induced pluripotent stem cells (iPSCs)) taken from GSE107654 are closely located. Thus, the MCC tissues and cell lines are not pluripotent.