
Figures & data
Figure 1. SOD3 expression is downregulated in breast cancer. (a) Comparison of SOD3 expression in breast tumours versus normal breast tissues with Agendia array analysis. N = 14 normal and 583 tumours. (b) Subtype-specific expression levels of SOD3. (c) Analysis of the SOD3 expression in the publicly available RNA seq data from TCGA comparing normal breast tissues versus breast tumours of various subtypes. In (B) and (C), * represents P < 0.0005 vs the normal tissues; individual P-values shown are comparison between the specific subtype vs the Luminal B subtype. Error bars indicate standard deviations. Oncomine analysis showing subtype specific expression of SOD3 from the Curtis Breast dataset (d) and Gluck Breast dataset (e). Numbers in brackets represent the numbers of tissue sample analysed
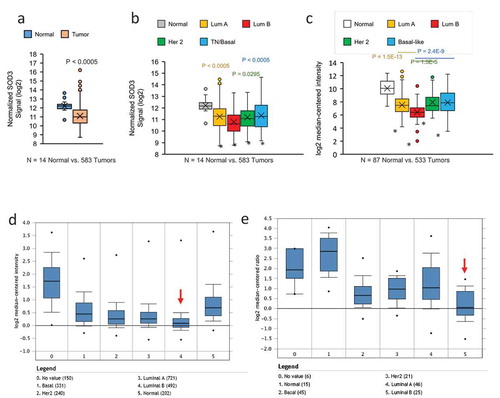
Figure 2. Methylation Status of the SOD3 Promoter. (a) A diagram depicting the pyrosequencing region of the SOD3 gene. The binding sites of known transcription factors are highlighted in sequence. The CpG sites are indicated by the blank lines and the number of bases away from the transcription start site for SOD3. (b) The average methylation across all 6 CpG sites tested by pyrosequencing comparing normal to tumour tissues. (c) The average methylation of the SOD3 promoter comparing the different breast cancer subtypes. * represents P < 0.05 vs normal tissues. (d) Methylation profile for each individual CpG sites in tumour tissues and normal tissues. * represents P < 0.005 vs normal tissues. Individual P-values shown are the P-values of the CpG position vs the −78 position. Error bars indicate standard deviations. (e) A heatmap indicating the methylation status of each CpG site for all the samples tested. The tissue type is indicated on the left edge of the heatmap
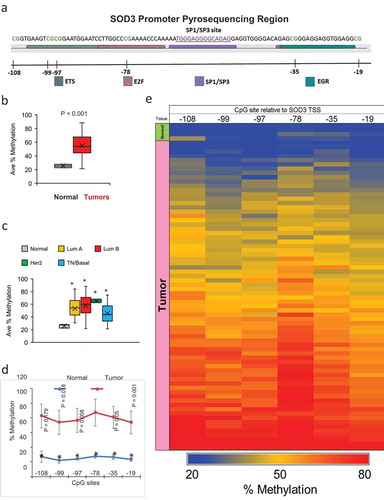
Figure 3. Correlation of SOD3 Expression with Promoter Methylation. (a-i) Spearman’s correlation between the % methylation of the SOD3 promoter and expression levels of SOD3 was used to determine the strength and direction of their association. Each graph indicates in the upper left corner which data set was used, either the BCCR cohort (A-D in the left panels) or the TCGA database (E-I in the right panels). The subtype of breast cancers is also indicated on the top of graph
Table 1. Correlation between specific SOD3 CpG methylation sites and mRNA expression in clinical subtypes
Table 2. Subtype-specific copy number variation of SOD3. This table indicates the various alterations of the SOD3 gene in breast cancer subtypes from the TCGA database. The percent of samples with SOD3 gene deletion is included at the bottom
Availability of data and materials
The datasets used and/or analysed during the current study are available from the TCGA network (https://www.cancer.gov/tcga), Oncomine platform (https://www.oncomine.org/resource/main.html) or from the corresponding author on reasonable request.