
Figures & data
Figure 1. WGBS Data. (a) Coverage levels across all CpGs. The mean coverage level was 17.7 reads per CpG. (b) PCA on all CpG DNAm levels shows that the top principal component – accounting for 10.3% of variance, is sex. However we can also see that there is another factor separating the two clusters of females, shown here to be embryonic stem (ES) cell fraction. (c) Root-mean-square deviation (RMSD) of WGBS measurements from 450k measurements for each sample. Mean RMSD is shown. (d) WGBS measured DNAm for each site on 450k, organized by 450k methylation measurement, of sample LIBD399, shown in the red circle in (C)
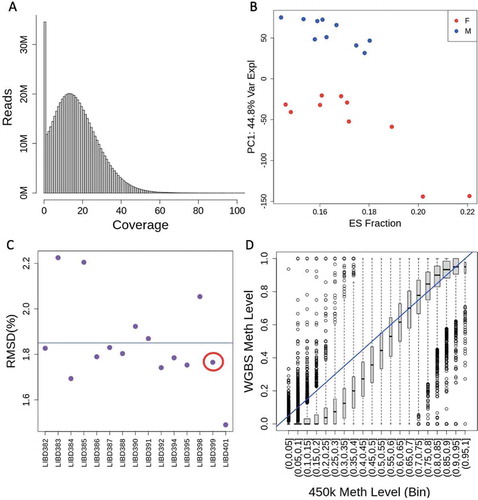
Figure 2. Methylation associations across ages and between sexes. (a) Percent change in methylation per post-conception week (PCW) across all significantly age-associated CpGs (FDR < 0.05). A positive % change indicates hypermethylation with increasing age. (b) An example of an age-associated CpG on chromosome 10. (c) Percent change in methylation between sexes at sex-associated CpGs, showing that the X chromosome tends to have greater percentage differences than autosomal CpGs. A positive % change indicates hypermethylation in males. (d) An example of a sex-associated CpG on chromosome 2
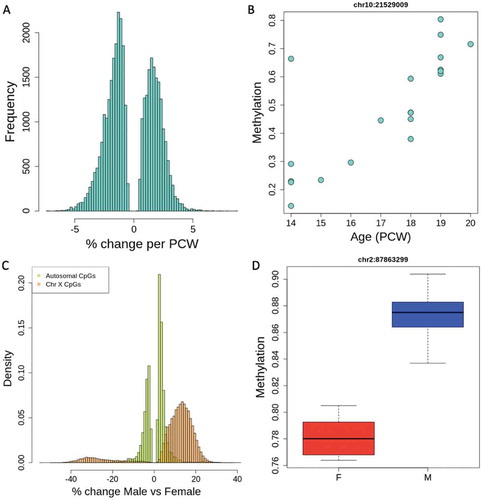
Figure 3. Gene Ontology (GO) and gene set enrichment for age-associated CpGs. The top 20 GO hits for all categories are plotted in order of significance (indicated by bar colour), showing the gene count for each GO category
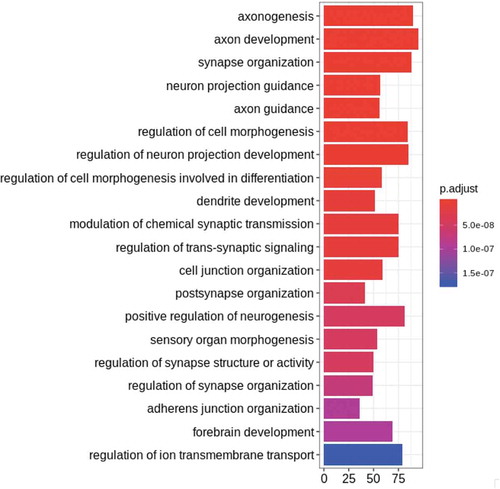
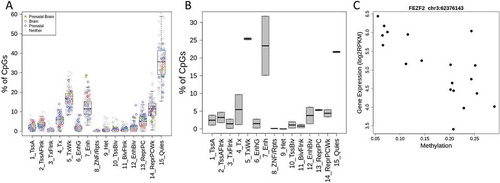
Figure 4. Functional consequences of differential methylation (a) Chromatin states of age-associated CpGs in various tissues. We show the distribution of chromatin states from the 15-state model of our CpGs in various tissues from the Roadmap Epigenomics Consortium. In Roadmap prenatal brain tissues, our sites are enriched for enhancer regions, and in all brain tissues, our sites are enriched for TSS sites. (b) Chromatin state of CpGs correlated to expression in prenatal brain tissue. We see that in prenatal brain tissue, most of our age-associated and expression-correlated CpGs are in weak transcription or enhancer states. Chromatin states are defined as follows. 1: Active TSS 2: Flanking Active TSS 3: Transcription at gene 5ʹ and 3ʹ 4: Strong transcription 5: Weak transcription 6: Genic enhancers 7: Enhancers 8: ZNF genes & repeats 9: Heterochromatin 10: Bivalent/Poised TSS 11: Flanking Bivalent TSS/Enhancer 12: Bivalent Enhancer 13: Repressed PolyComb 14: Weak Repressed PolyComb 15: Quiescent/Low (c) An example of correlation between methylation level at a promoter and gene expression. Gene expression from RNA-seq is plotted against DNAm level at a correlated site, showing a decrease in gene expression with increasing methylation in example gene FEZF2
Supplemental Material
Download MS Word (495.2 KB)Supplemental Material
Download MS Excel (6.1 MB)Availability of data and materials
Raw and processed nucleic acid sequencing data generated to support the findings of this study are part of the PsychENCODE Consortium and the Brainseq Consortium data releases. Specifically, WGBS data have been deposited at www.Synapse.org along with the other PsychENCODE data, under the accession code syn5842535. The homogenate RNA-seq samples were also part of a larger study of RNA-seq data from homogenate DLPFC tissue (BrainSeq Consortium Phase I) [50], which was also deposited at www.synapse.org and summarized in http://eqtl.brainseq.org/phase1. The processed, homogenate RNA-seq data for this study have additionally been deposited via Globus under the jhpce#brainepi-cellsorted collection at the following location: http://research.libd.org/globus/jhpce_brainepi-cellsorted/. NeuN-sorted RNA-seq data were originally published as part of phase II of the Brainseq Consortium (http://eqtl.brainseq.org/phase2/) and have also been deposited via Globus under the jhpce#brainepi-polyA collection at the following location: http://research.libd.org/globus/jhpce_brainepi-polyA/. Publicly available data reprocessed in support of the conclusions in this work were downloaded from the Gene Expression Omnibus under GEO accession GSE47966 and GSE74193.