Figures & data
Figure 1. Deconvoluted MS profiles from LC-MS analysis of intact core histones under normoxia and hypoxia. Intact histone profiles from (a) HEK 293T, (b) HeLa and (c) RKO cells cultured for 24 hours under normoxia (21% O2) or severe hypoxia (0.1% O2). Coloured traces indicate the sample from control cells grown in normoxia (black) or cells treated under severe hypoxia for 24 hours (red)
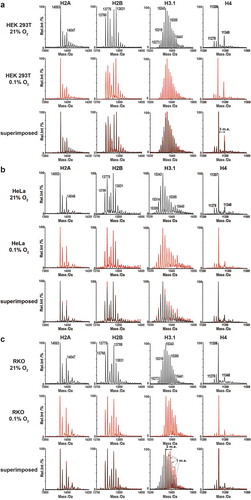
Figure 2. Histone H3.1 PTM profiles following treatment of cells with hypoxia or hypoxia mimetics. Histones were extracted from HEK 293T cells treated for 24 hours with: (a,b) normoxia (21% O2), hypoxia (1% O2), or severe hypoxia (0.1% O2); (c,d) 50, 75, 100, 125 and 150 μM DFO; (e,f) 25, 50, 75, 100 and 125 μM CP20; (g,h) 50, 100, 150 and 200 μM CoCl2. (a,c,e,g) The ion count for each mass spectral peak is expressed as a percentage of the total ion count. (b,d,f,h) The ion count for each peak as a percentage of the total ion count is expressed as a change relative to the peak intensity in control cells in each experiment. Data are expressed as mean ion counts ± SEM (n = 3). m.e.: number of methylation equivalents
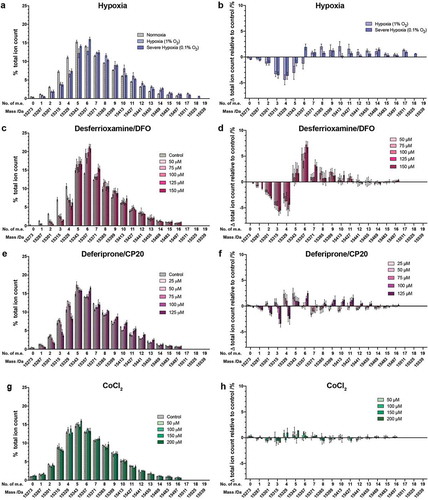
Figure 3. Histone H3.1 PTM profiles following treatment of cells with 2OG oxygenase inhibitors. Histones were extracted from HEK 293T cells treated for 24 hours with various concentrations of: (a) DMOG; (b) IOX2; (c) FG4592. The ion count for each peak as a percentage of the total ion count is expressed as a change relative to the control cells in each experiment. Data are means ± SEM (n = 3). m.e.: number of methylation equivalents
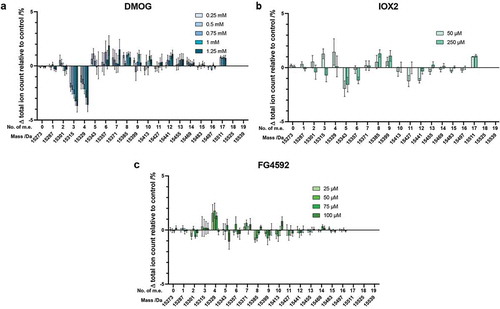
Figure 4. Analysis of histone H4 following treatment of cells with hypoxia, hypoxia mimetics or 2OG oxygenase inhibitors. Histones were extracted from HEK 293T cells treated for 24 hours with various concentrations of (a) hypoxia, (b) DFO, (c) CP20, (d) CoCl2, (e) DMOG, (f) IOX2 or (g) FG4592. The ion count for each peak as a percentage of the total ion count is expressed as a change relative to the control cells in each experiment. Data are means ± SEM (n = 3). No. of m.e.: number of methylation equivalents
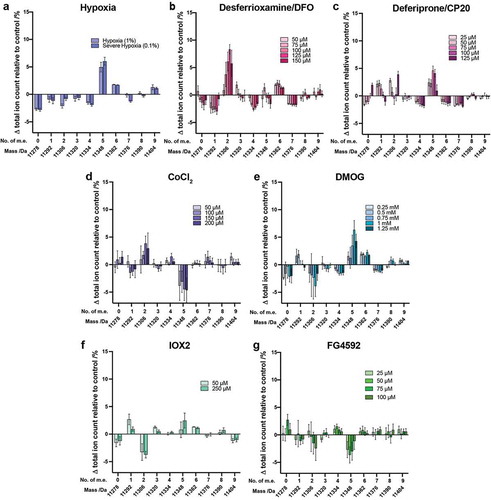
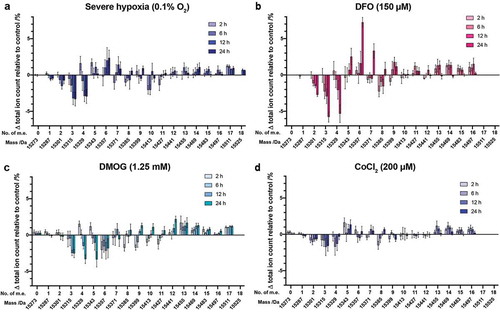
Figure 5. Changes in H3.1 PTM profiles over time following a range of hypoxic stresses. Histones were extracted from HEK 293T cells treated with (a) severe hypoxia (0.1% O2), (b) DFO (150 µM), (c) DMOG (1.25 mM), (d) CoCl2 (200 µM) for various times. The ion count for each peak as a percentage of the total ion count is expressed as a change relative to the control cells in each experiment. Data are means ± SEM (n = 3). No. of m.e: number of methylation equivalents