710
Views
9
CrossRef citations to date
0
Altmetric
Research Paper

Epigenetic regulation of miR-518a-5p-CCR6 feedback loop promotes both proliferation and invasion in diffuse large B cell lymphoma

ORCID Icon, ORCID Icon, ORCID Icon & ORCID Icon
Pages 28-44 | Received 08 Jan 2020, Accepted 22 May 2020, Published online: 30 Jun 2020

Figures & data

Figure 1. CCR6 and miR-518a-5p expression levels in DLBCL cell lines and tissues. (a). The expression level of CCR6 was measured in two DLBCL cell lines; (b). Western blot analysis (left) and densitometric analysis (right) for CCR6 in the SU-DHL-2 cell line compared with the normal B cell line HMy2.CIR; (c). Western blot analysis (left) and densitometric analysis (right) for CCR6 in the SU-DHL-6 cell line compared with the normal B cell line HMy2.CIR; (d). CCR6 expression in seven other cell lines from the CCLE database; €. Expression levels of CCR6 in DLBCL samples compared with the control group; (f). ROC analysis for the accuracy of CCR6 in the diagnosis of DLBCL; G. qRT-PCR analysis for miR-518a-5p expression in two DLBCL cell lines compared with the normal B cell line HMy2.CIR; H. qRT-PCR analysis for miR-518a-5p expression levels in DLBCL samples compared with the control group; I. The correlation between miR-518a-5p and CCR6 evaluated by the Pearson correlation test. *P < 0.05 and **P < 0.01

Figure 1. CCR6 and miR-518a-5p expression levels in DLBCL cell lines and tissues. (a). The expression level of CCR6 was measured in two DLBCL cell lines; (b). Western blot analysis (left) and densitometric analysis (right) for CCR6 in the SU-DHL-2 cell line compared with the normal B cell line HMy2.CIR; (c). Western blot analysis (left) and densitometric analysis (right) for CCR6 in the SU-DHL-6 cell line compared with the normal B cell line HMy2.CIR; (d). CCR6 expression in seven other cell lines from the CCLE database; €. Expression levels of CCR6 in DLBCL samples compared with the control group; (f). ROC analysis for the accuracy of CCR6 in the diagnosis of DLBCL; G. qRT-PCR analysis for miR-518a-5p expression in two DLBCL cell lines compared with the normal B cell line HMy2.CIR; H. qRT-PCR analysis for miR-518a-5p expression levels in DLBCL samples compared with the control group; I. The correlation between miR-518a-5p and CCR6 evaluated by the Pearson correlation test. *P < 0.05 and **P < 0.01

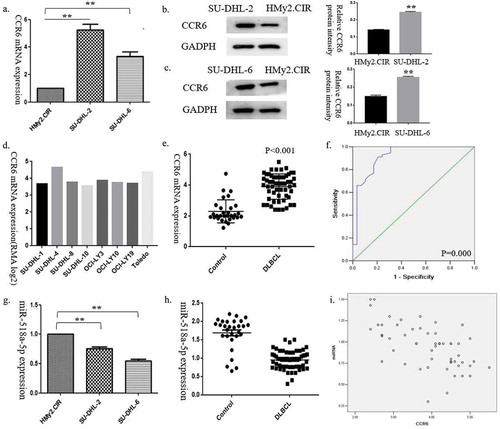
Table 1. The correlation between CCR6 expression and clinicopathological features in DLBCL

Table 2. The correlation between miR-518a-5p expression and clinicopathological features in DLBCL

Figure 2. A negative regulatory feedback loop between miR-518a-5p and CCR6 in DLBCL. (a). qRT-PCR (left) and western blot analysis (middle and right) of CCR6 for the efficiency of miR-518a-5p overexpression in SU-DHL-2 cells; (b). qRT-PCR (left) and western blot analysis (middle and right) of CCR6 for the efficiency of miR-518a-5p overexpression in SU-DHL-6 cells; (c). qRT-PCR analysis of miR-518a-5p for the efficiency of CCR6 knockdown in both SU-DHL-2 and SU-DHL-6 cells; D. The binding site between miR-518a-5p and the 3ʹ-UTR of CCR6 mRNA (upper) as well as the result of dual luciferase assay (lower). *P < 0.05 and **P < 0.01

Figure 2. A negative regulatory feedback loop between miR-518a-5p and CCR6 in DLBCL. (a). qRT-PCR (left) and western blot analysis (middle and right) of CCR6 for the efficiency of miR-518a-5p overexpression in SU-DHL-2 cells; (b). qRT-PCR (left) and western blot analysis (middle and right) of CCR6 for the efficiency of miR-518a-5p overexpression in SU-DHL-6 cells; (c). qRT-PCR analysis of miR-518a-5p for the efficiency of CCR6 knockdown in both SU-DHL-2 and SU-DHL-6 cells; D. The binding site between miR-518a-5p and the 3ʹ-UTR of CCR6 mRNA (upper) as well as the result of dual luciferase assay (lower). *P < 0.05 and **P < 0.01

Figure 3. MiR-518a-5p/CCR6 accelerates DLBCL cell proliferation and invasion in vitro. (a). The proliferative ability of DLBCL miR-518a-5p mimic/negative control (left) cells and DLBCL CCR6 inhibitor/negative control (right) cells was measured via the CCK-8 assay; (b). The SU-DHL-2 and SU-DHL-6 cells with miR-518a-5p mimic or CCR6 inhibitor transfection were subjected to the colony formation assay; (c). The cell apoptosis of SU-DHL-2 CCR6 inhibitor/negative control (upper) cells and SU-DHL-6 CCR6 inhibitor/negative control (lower) cells was measured through flow cytometry analysis; (d). The cell apoptosis of SU-DHL-2 miR-518a-5p mimic/negative control (upper) cells and SU-DHL-6 miR-518a-5p mimic/negative control (lower) cells was measured through flow cytometry analysis; (e). The cell cycle of SU-DHL-2 CCR6 inhibitor/negative control (upper) cells and SU-DHL-6 CCR6 inhibitor/negative control (lower) cells was measured through flow cytometry analysis; (f). The invasion ability of SU-DHL-2 CCR6 inhibitor/negative control (upper) cells and SU-DHL-6 CCR6 inhibitor/negative control (lower) cells was measured through the Transwell assay; (g). The invasion ability of SU-DHL-2 miR-518a-5p mimic/negative control (upper) cells and SU-DHL-6 miR-518a-5p mimic/negative control (lower) cells was measured through the Transwell assay; (h). The proliferative capacity of SU-DHL-2 miR-518a-5p inhibitor/negative control cells with co-transfection of the CCR6 inhibitor was indicated by CCK-8; (i). The invasion capacity of SU-DHL-2 miR-518a-5p inhibitor/negative control cells with co-transfection of the CCR6 inhibitor was indicated via the Transwell assay; (j). The proliferative capacity of SU-DHL-2 miR-518a-5p inhibitor/negative control cells with co-transfection of the CCR6 inhibitor was indicated through the colony formation assay; (k). The cell apoptosis of SU-DHL-2 miR-518a-5p inhibitor/negative control cells with co-transfection of the CCR6 inhibitor was measured through flow cytometry analysis. The data were represented as the means ± standard deviation of three independent experiments. *P < 0.05 and **P < 0.01

Figure 3. MiR-518a-5p/CCR6 accelerates DLBCL cell proliferation and invasion in vitro. (a). The proliferative ability of DLBCL miR-518a-5p mimic/negative control (left) cells and DLBCL CCR6 inhibitor/negative control (right) cells was measured via the CCK-8 assay; (b). The SU-DHL-2 and SU-DHL-6 cells with miR-518a-5p mimic or CCR6 inhibitor transfection were subjected to the colony formation assay; (c). The cell apoptosis of SU-DHL-2 CCR6 inhibitor/negative control (upper) cells and SU-DHL-6 CCR6 inhibitor/negative control (lower) cells was measured through flow cytometry analysis; (d). The cell apoptosis of SU-DHL-2 miR-518a-5p mimic/negative control (upper) cells and SU-DHL-6 miR-518a-5p mimic/negative control (lower) cells was measured through flow cytometry analysis; (e). The cell cycle of SU-DHL-2 CCR6 inhibitor/negative control (upper) cells and SU-DHL-6 CCR6 inhibitor/negative control (lower) cells was measured through flow cytometry analysis; (f). The invasion ability of SU-DHL-2 CCR6 inhibitor/negative control (upper) cells and SU-DHL-6 CCR6 inhibitor/negative control (lower) cells was measured through the Transwell assay; (g). The invasion ability of SU-DHL-2 miR-518a-5p mimic/negative control (upper) cells and SU-DHL-6 miR-518a-5p mimic/negative control (lower) cells was measured through the Transwell assay; (h). The proliferative capacity of SU-DHL-2 miR-518a-5p inhibitor/negative control cells with co-transfection of the CCR6 inhibitor was indicated by CCK-8; (i). The invasion capacity of SU-DHL-2 miR-518a-5p inhibitor/negative control cells with co-transfection of the CCR6 inhibitor was indicated via the Transwell assay; (j). The proliferative capacity of SU-DHL-2 miR-518a-5p inhibitor/negative control cells with co-transfection of the CCR6 inhibitor was indicated through the colony formation assay; (k). The cell apoptosis of SU-DHL-2 miR-518a-5p inhibitor/negative control cells with co-transfection of the CCR6 inhibitor was measured through flow cytometry analysis. The data were represented as the means ± standard deviation of three independent experiments. *P < 0.05 and **P < 0.01

Figure 4. Up-regulation of miR-518a-5p and down-regulation of CCR6 attenuated JAK2-STAT6 signalling pathway activity. (a). The KEGG pathway of CCR6; (b). qRT-PCR analysis of JAK1-2, STAT3-6 mRNA expression in miR-518a-5p mimic/negative control SU-DHL-2 (left) and SU-DHL-6 (right) cells; (c). Western blot analysis and densitometric analysis of JAK2 and STAT6 in miR-518a-5p mimic/negative control SU-DHL-2 and SU-DHL-6 cells; (d). qRT-PCR analysis of JAK1-2, STAT3-6 mRNA expression in CCR6 inhibitor/negative control SU-DHL-2 (left) and SU-DHL-6 (right) cells; (e). Western blot analysis and densitometric analysis of JAK2 and STAT6 in CCR6 inhibitor/negative control SU-DHL-2 and SU-DHL-6 cells. *P < 0.05 and **P < 0.01

Figure 4. Up-regulation of miR-518a-5p and down-regulation of CCR6 attenuated JAK2-STAT6 signalling pathway activity. (a). The KEGG pathway of CCR6; (b). qRT-PCR analysis of JAK1-2, STAT3-6 mRNA expression in miR-518a-5p mimic/negative control SU-DHL-2 (left) and SU-DHL-6 (right) cells; (c). Western blot analysis and densitometric analysis of JAK2 and STAT6 in miR-518a-5p mimic/negative control SU-DHL-2 and SU-DHL-6 cells; (d). qRT-PCR analysis of JAK1-2, STAT3-6 mRNA expression in CCR6 inhibitor/negative control SU-DHL-2 (left) and SU-DHL-6 (right) cells; (e). Western blot analysis and densitometric analysis of JAK2 and STAT6 in CCR6 inhibitor/negative control SU-DHL-2 and SU-DHL-6 cells. *P < 0.05 and **P < 0.01

Figure 5. MiR-518a-5p is under the regulation of methylation in DLBCL cells. (a). Different methylation levels existed on the miR-518a-5p promoter region between DLBCL tissues and reactive lymphoid hyperplasia; (b). Methylation analysis of miR-518a-5p through MSP in SU-DHL-2 (upper) and SU-DHL-6 (lower) cells; (c). Methylation levels of two CpG sites on the miR-518a-5p promoter region were examined via pyrosequencing analysis in SU-DHL-2 (left) and SU-DHL-6 (right) cells; (d). Relative miR-518a-5p expression levels determined by Control/Azacitidine in SU-DHL-2 and SU-DHL-6 cells; (e). Different concentrations (0, 2, 4, 6 μmol/L) and times (0, 12, 24, 48 h) were applied to determine the effects of Azacitidine on miR-518a-5p expression in DLBCL cells; (f). The mRNA levels of CCR6 in SU-DHL-2 and SU-DHL-6 cells when treated with Azacitidine/Control; (g). Western blot analysis and densitometric analysis of CCR6 in SU-DHL-2 (upper) and SU-DHL-6 (lower) cells when treated with Azacitidine/Control. The data are shown as the means±standard deviation of three independent experiments. *P < 0.05 and **P < 0.01

Figure 5. MiR-518a-5p is under the regulation of methylation in DLBCL cells. (a). Different methylation levels existed on the miR-518a-5p promoter region between DLBCL tissues and reactive lymphoid hyperplasia; (b). Methylation analysis of miR-518a-5p through MSP in SU-DHL-2 (upper) and SU-DHL-6 (lower) cells; (c). Methylation levels of two CpG sites on the miR-518a-5p promoter region were examined via pyrosequencing analysis in SU-DHL-2 (left) and SU-DHL-6 (right) cells; (d). Relative miR-518a-5p expression levels determined by Control/Azacitidine in SU-DHL-2 and SU-DHL-6 cells; (e). Different concentrations (0, 2, 4, 6 μmol/L) and times (0, 12, 24, 48 h) were applied to determine the effects of Azacitidine on miR-518a-5p expression in DLBCL cells; (f). The mRNA levels of CCR6 in SU-DHL-2 and SU-DHL-6 cells when treated with Azacitidine/Control; (g). Western blot analysis and densitometric analysis of CCR6 in SU-DHL-2 (upper) and SU-DHL-6 (lower) cells when treated with Azacitidine/Control. The data are shown as the means±standard deviation of three independent experiments. *P < 0.05 and **P < 0.01

Figure 6. H3K27ac in the promoter of CCR6 promotes CCR6 transcription. (a). Enrichment analysis of H3K27Ac in CCR6 promoter in DLBCL cell lines through Cistrome Data Browser; (b). Different concentrations (0, 4, 8 μmol/L) and times (0, 12, 24, 48 h) were applied to determine the effects of C646 on the CCR6 expression in DLBCL cells; (c). Alteration of H3K27ac enrichment in CCR6 promoter in SU-DHL-2 (left) and SU-DHL-6 (right) cell line after C646 treatment

Figure 6. H3K27ac in the promoter of CCR6 promotes CCR6 transcription. (a). Enrichment analysis of H3K27Ac in CCR6 promoter in DLBCL cell lines through Cistrome Data Browser; (b). Different concentrations (0, 4, 8 μmol/L) and times (0, 12, 24, 48 h) were applied to determine the effects of C646 on the CCR6 expression in DLBCL cells; (c). Alteration of H3K27ac enrichment in CCR6 promoter in SU-DHL-2 (left) and SU-DHL-6 (right) cell line after C646 treatment

Figure 7. A schematic diagram is used to illuminate regulation in our study. MiR-518a-5p was forced to be inhibited due to high enrichment of DNA methylation on its promoter region, which can be partially reversed in the presence of azacitibine in DLBCL cells. In view of the negative feedback loop between miR-518a-5p and CCR6, the enhanced levels of CCR6 in DLBCL is due to the methylation regulation of miR-518a-5p and histone H3K27 acetylation at the CCR6 promoter region. Down-regulated miR-518a-5p and up-regulated CCR6 activates the JAK2-STAT6 signalling pathway to promote the proliferation and invasion of DLBCL cells, indicating an important role of the miR-518a-5p-CCR6 feedback loop in DLBCL

Figure 7. A schematic diagram is used to illuminate regulation in our study. MiR-518a-5p was forced to be inhibited due to high enrichment of DNA methylation on its promoter region, which can be partially reversed in the presence of azacitibine in DLBCL cells. In view of the negative feedback loop between miR-518a-5p and CCR6, the enhanced levels of CCR6 in DLBCL is due to the methylation regulation of miR-518a-5p and histone H3K27 acetylation at the CCR6 promoter region. Down-regulated miR-518a-5p and up-regulated CCR6 activates the JAK2-STAT6 signalling pathway to promote the proliferation and invasion of DLBCL cells, indicating an important role of the miR-518a-5p-CCR6 feedback loop in DLBCL
Supplemental material

Supplemental Material

Download MS Word (23.7 KB)

Reprints and Corporate Permissions

Please note: Selecting permissions does not provide access to the full text of the article, please see our help page How do I view content?

To request a reprint or corporate permissions for this article, please click on the relevant link below:

Academic Permissions

Please note: Selecting permissions does not provide access to the full text of the article, please see our help page How do I view content?

Obtain permissions instantly via Rightslink by clicking on the button below:

If you are unable to obtain permissions via Rightslink, please complete and submit this Permissions form. For more information, please visit our Permissions help page.