Figures & data
Figure 1. HMBA evokes primarily growth arrest in C6 glioma cells. a) Cell counts using trypan blue and b) DNA histograms of 7-AAD-stained nuclei quantifying the sub-G1 content together indicate that the primary response to HMBA-treatment in C6 glioma cells is growth arrest. c) Quantification of cells with less than diploid DNA content in b). d) Plot summarizing the results from the pharmacological screen of HMBA in combination with 226 different compounds. The three red dots indicate the three MEK inhibitors which all fall below the line of equal measured and expected
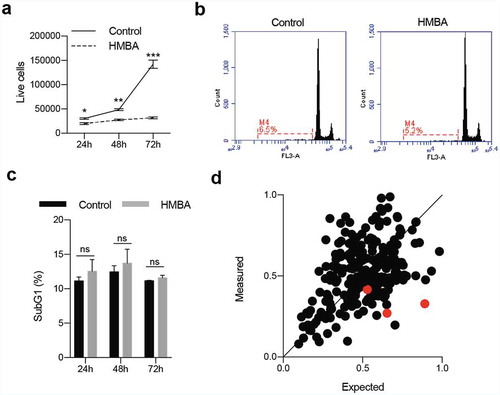
Figure 2. Combination of BET inhibitors and MEK inhibitors enhance cell death in C6 rat glioma cells. a) Clonogenic assay of C6 treated with HMBA, trametinib or the combination of both. b) Cell viability of single treatment or combination using Cell Titre Glo. The dotted indicates the expected value of an additive effect of the combination c) Percent of cells with less than diploid DNA content (sub-G1). The high rates in combination treatment could be suppressed with pan-caspase inhibitor Q-VD-OPH, suggesting apoptosis. d) and e) Viability and sub-G1 assessments of combinations of BET inhibitors HMBA, JQ1 and I-BET762 together with MEK inhibitors trametinib, TAK733, AZD8330 and binimetinib. Single asterisks or hash signs indicate significant values of p < 0.05, double signs are p < 0.01, triple signs are p < 0.001 and quadruple signs are p < 0.0001
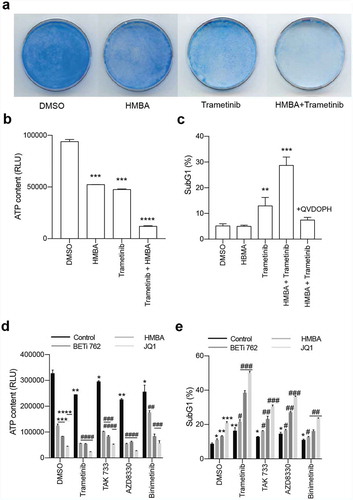
Figure 3. Inhibiting p-gp activity with elacridar affects trametinib activity but does not synergize with trametinib to kill C6 cells. a) Flow cytometry analysis for p-gp activity showing p-gp substrate Rhodamine 123 being pumped out of cells (DMSO, bottom panel whereas inhibiting p-gp with elacridar blocks this pumping (Elacridar, bottom panel). b) Blocking p-gp with elacridar enhanced the activity of trametinib as judged by lowered P-ERK on Western blot. Values of relative expression to actin and the control, assessed by densitometry, is below images. Uncropped images are in Supplemental Figure S2. c) Viability assay showing that inhibiting p-gp with elacridar does not enhance killing by trametinib. d) Viability assay of combination treatments with elacridar and HMBA or JQ1. e) and f) Viability and sub-G1 assessments of combinations of BET inhibitors HMBA and JQ1 together with ERK inhibitor SCH772984
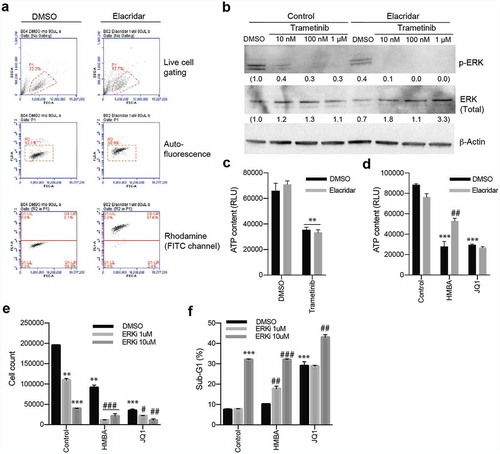
Figure 4. Treatments in vivo of C6 glioma with HMBA (2.5% HMBA in drinking water), trametinib (0.5 mg/kg mouse mixed in food) or combination. a) Tumour volumes over time with respective treatment. Significance of curve comparisons (asterisks) are made for vehicle and trametinib+HMBA treated mice. b) Survival curve indicating the elapsed time for tumours in the different treatment to reach ethical size limit, n = 4 in each group
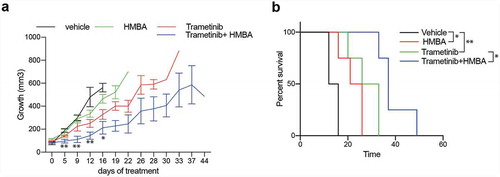
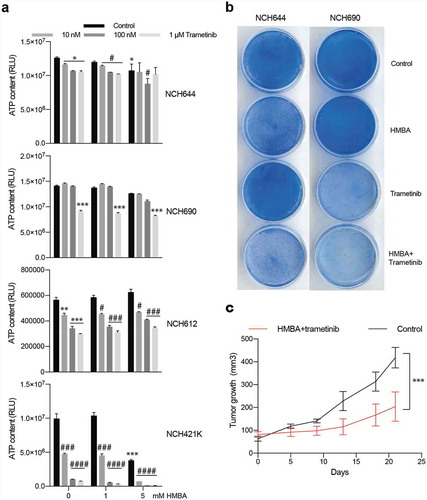
Figure 5. Human glioma cells are sensitive to combination of HMBA and trametinib. a) Viability assay of four human glioma cell lines treated for three days as spheres with HMBA and varying concentrations of trametinib. b) Clonogenic assay of cell lines NCH644 and NCH690 growing adherently on plastic showing potency of combination treatment. c) Tumour growth in vivo of NCH421K cells growing subcutaneously on NOG mice and treated with combination of HMBA+trametinib