Figures & data
Figure 1. The effect of FA on p53 expression in HepG2 cells. (a) RNA isolated from control and FA-treated HepG2 cells were reverse transcribed into cDNA and analyzed for p53 expression using qPCR. FA decreased the mRNA expression of p53 in HepG2 cells. (b) Protein expression of p53 was determined using Western blot. FA decreased the protein expression of p53 in HepG2 cells. Results are represented as mean fold-change ± SD (n = 3). Statistical significance was determined by one-way ANOVA with the Bonferroni multiple comparisons test (***p < 0.0001)
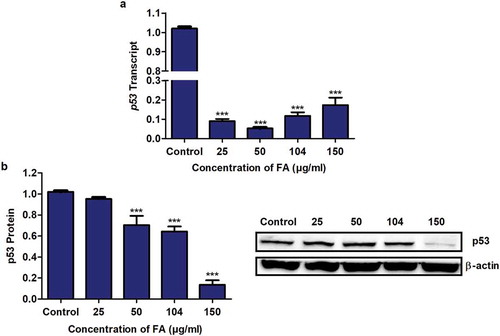
Figure 2. The effect of FA on the promoter methylation of p53 in HepG2 cells. DNA isolated from control and FA-treated HepG2 cells were assayed for p53 promoter methylation using the OneStep qMethyl Kit. FA altered p53 promoter methylation in HepG2 cells. Results are represented as mean fold-change ± SD (n = 3). Statistical significance was determined by one-way ANOVA with the Bonferroni multiple comparisons test (***p < 0.0001)
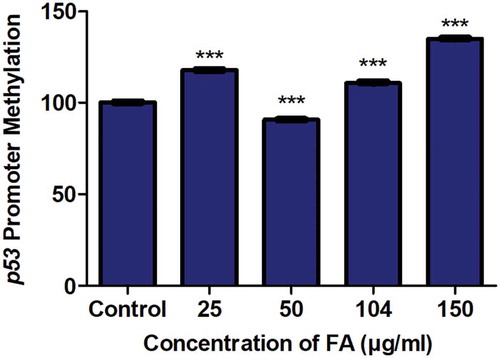
Figure 3. The effect of FA on m6A-p53 levels in HepG2 cells. RNA immuno-precipitation using m6A antibody and quantification of p53 mRNA levels in control and FA-treated HepG2 cells. FA decreased m6A-p53 levels in HepG2 cells. Results are represented as mean fold-change ± SD (n = 3). Statistical significance was determined by one-way ANOVA with the Bonferroni multiple comparisons test (***p < 0.0001)
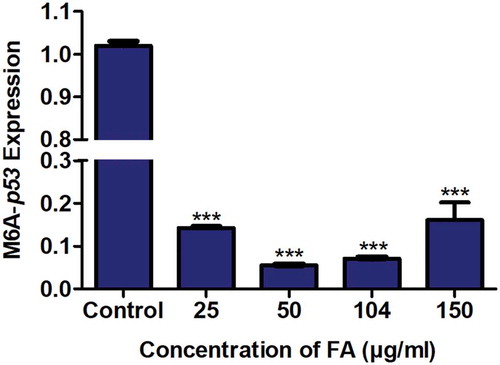
Figure 4. The effect of FA on the expression of m6A methyltransferases and demethylases in HepG2 cells. RNA isolated from control and FA-treated HepG2 cells were reverse transcribed into cDNA and analyzed for METTL3, METTL14, FTO, and ALKBH5 expression using qPCR. FA decreased the mRNA expression of METTL3 (a), METTL14 (b), FTO (c), and ALKBH5 (d) in HepG2 cells. Results are represented as mean fold-change ± SD (n = 3). Statistical significance was determined by one-way ANOVA with the Bonferroni multiple comparisons test (***p < 0.0001)
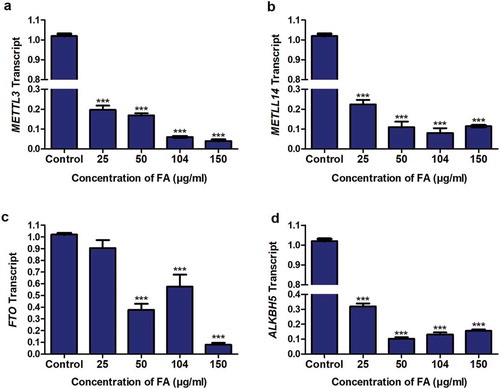
Figure 5. The effect of FA on the expression of m6A readers in HepG2 cells. RNA isolated from control and FA-treated HepG2 cells were reverse transcribed into cDNA and analyzed for the expression of YTHDF1, YTHDF2, YTHDF3, and YTHDC2 by qPCR. FA decreased the expression of YTHDF1 (a), YTHDF2 (b), YTHDF3 (c), and YTHDC2 (d) in HepG2 cells. Results are represented as mean fold-change ± SD (n = 3). Statistical significance was determined by one-way ANOVA with the Bonferroni multiple comparisons test (***p < 0.0001)
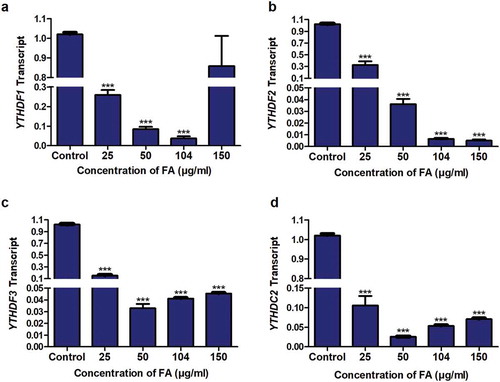
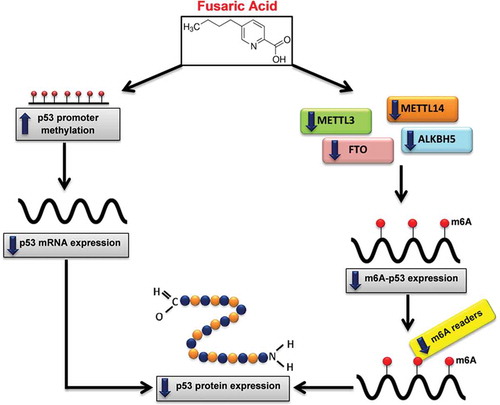
Figure 6. Proposed mechanism of FA-induced decrease in p53 expression. FA decreases p53 expression at both the transcript and protein levels by inducing p53 promoter hypermethylation and decreasing m6A-p53 methylation levels. FA decreased m6A-p53 levels by decreasing METTL3 and METTL14; and suppressed expression of the m6A readers, YTHDF1, YTHDF3, and YTHDC2, which led to the decrease in p53 translation/protein expression. Furthermore, the decrease in p53 protein expression may be a consequence of the FA-induced decrease in p53 mRNA expression