
Figures & data
Figure 1. Schematic illustration of the experimental design and bioinformatic analysis strategy to determine the correspondence between bone and blood methylomes
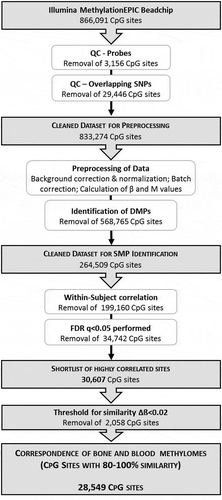
Figure 2. Beta-value density plots of the raw and preprocessed data for bone and blood
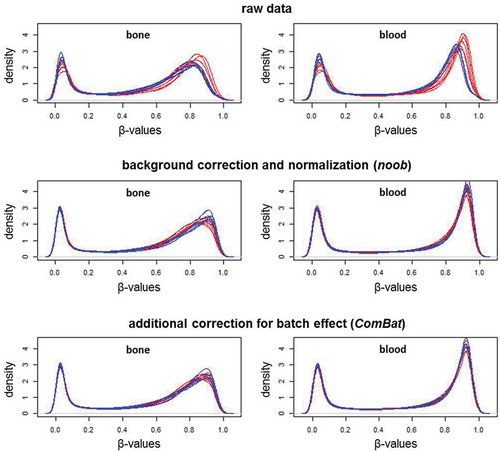
Figure 3. Multi-dimensional scaling plots of the M-values in the raw and preprocessed data for bone and blood
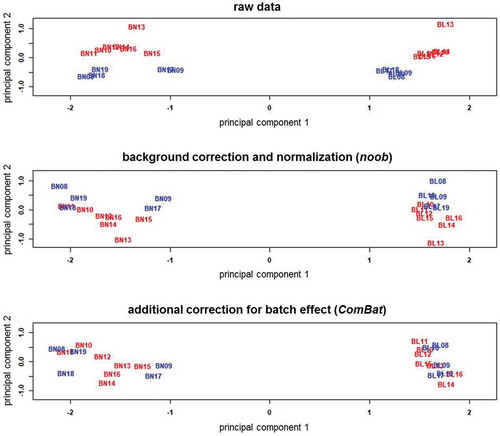
Figure 4. Enrichment of DMPs according to genomic and CpG island coordinates
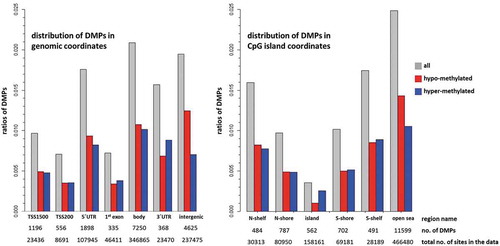
Figure 5. Permutation analysis on the correlation testing to identify similarly methylated positions
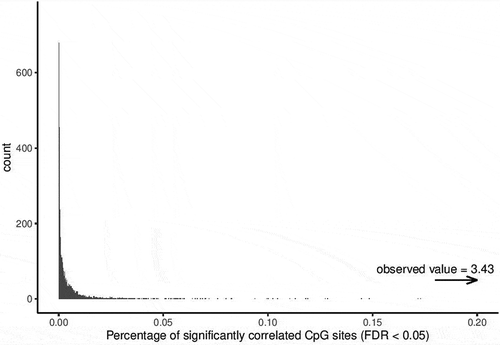
Figure 6. Enrichment of SMP according to genomic and CpG island coordinates
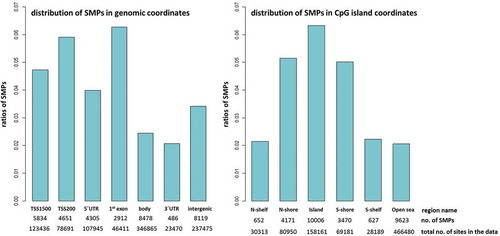
Table 1. Number of loci for bone phenotypes extracted from the GWAS catalogue (A), number of GWAS loci represented among the similarly methylated positions
Figure 7. Methylation levels in bone versus blood samples in the SMPs overlapping with 3 examples of genes involved in pathways known to be critical to bone biology – ESR1, EN1, and Wnt16.
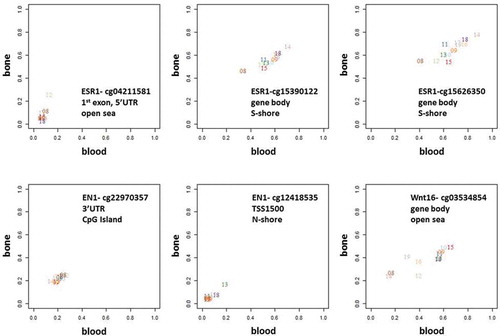
Table 2. Pathway enrichment analysis using the molecular signatures database (MSigDB) on all the SMPs (FDR q-value of correlation< 0.05, and Δβ<0.2)
Table 3. Pathway enrichment analysis using the molecular signatures database (MSigDB) on a ‘core’ set of highly significantly correlated SMPs (FDR q-value of correlation< 0.005, and Δβ<0.2)