
Figures & data
Figure 1. ATAC-seq identified peaks in IL-1-stimulated chondrocytes
SW1353 cells were stimulated in triplicate with IL-1 for 6 hours prior to nuclei isolation and ATAC-seq. A. Heatmap and hierarchical clustering representation of the 241 differentially accessible peaks. B. Genomic vignette of significant peaks (green bar) within the STX8 and DIPK1A/FAM69A gene loci. Roadmap MSC-derived chondrocyte chromatin states (white = quiescent, light yellow = poised enhancer) and MEME-identified RelA motifs are depicted in the tracks below. C. All peaks and significant peak distribution relative to TSS. D. Enrichment of peaks at Roadmap E049 MSC-derived chondrocyte chromatin states. E. GO analysis of more and less accessible peak proximal genes. F. Motif analysis of more and less accessible peaks assessed using MEME and TOMTOM. G. Overlap of more and less accessible peak regions with ChIP-seq-identified IL-1-induced RelA binding sites.
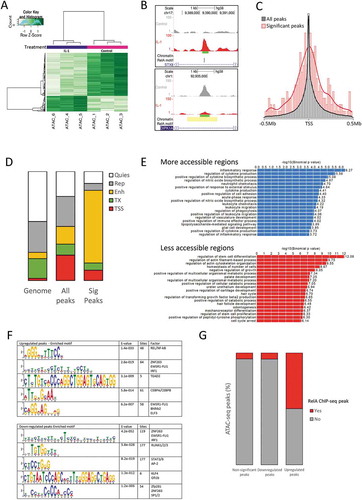
Figure 2. Correlation between differentially accessible chromatin regions and gene expression changes
A. Volcano plot of gene expression from SW1353 stimulated with IL-1 for 6 hours prior to RNA extraction and microarray analysis. Significantly up- and down-regulated genes are represented by green and red dots respectively. B. Comparison of significant ATAC-seq peak accessibility fold change with expression change in proximal gene. Genes labelled were those selected for functional validation.
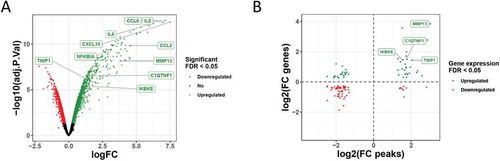
Figure 3. Effect of Cas9-mediated putative enhancer deletion on IL-1-induced gene expression
A. Genomic vignette of significant ATAC-seq peaks (green bar) within the MMP13, C1QTNF1, IKBKE and TNIP1 loci following IL-1 stimulation. Numbers 21,603, 48,601, 8848, 90,201 refer to the peak identifier defined by MACS2. Roadmap MSC-derived chondrocyte chromatin states (white = quiescent, yellow = active enhancer, dark yellow = strong enhancer, light yellow = poised enhancer, and green = weak transcription), MEME-identified RelA motifs and ChIP-seq-identified IL-1-induced RelA binding sites are depicted in the tracks below. B. PCR determination of gRNA-targetted Cas9 deletion of ATAC-seq peak regions. Black and red arrrowheads indicate expected wild-type and deletion PCR products, respectively. C. Expression of the indicated genes measured by real-time qRT-PCR in SW1353-Cas9 cells following Cas9-mediated deletion of ATAC-seq regions. Values are mean ± standard error of the mean (SEM) of data pooled from between 3 and 6 independent experiments (each performed in sextuplate). *P < 0.05; **P < 0.01 for deletion versus wild-type for each control or IL-1 treatment group. Significant differences between sample groups were assessed by a two-tailed Student’s t-test.
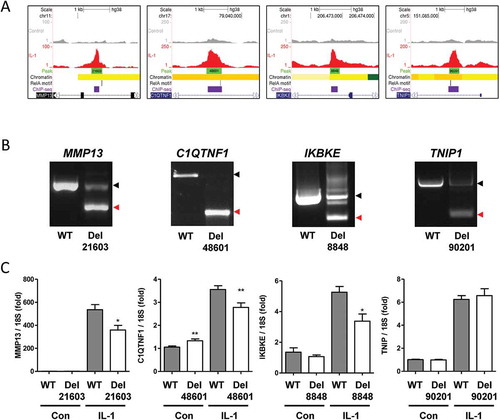
Figure 4. Effect of enhancer-targetted Cas9-VPR on gene expression
Expression of the indicated genes measured by real-time qRT-PCR in SW1353-Cas9-VPR cells following transfection of ATAC-seq region gRNAs and IL-1 stimulation for 6 hours. Numbers 21,603, 48,601, 8848, 90,201 refer to the ATAC-seq peak identifier defined by MACS2. Values are mean ± SEM of data pooled from two independent experiments (performed in sextuplate). *P < 0.05; **P < 0.01; ***P < 0.001 for deletion versus wild-type for each control or IL-1 treatment group. Significant differences between sample groups were assessed by a two-tailed Student’s t-test.
Figure 5. Enhancer activity of differentially accessible chromatin regions
Luciferase activity in SW1353 cells transfected with pGL3-promoter containing wild-type and deleted ATAC-seq peak-containing regions (MACS2 identifier is given) following IL-1 stimulation for 6 or 24 hours. Values are mean ± SEM of data pooled from two independent experiments (each performed in sextuplate). *P < 0.05; ***P < 0.001 for IL-1 treatment versus unstimulated cells. All firefly luciferase data were normalized to Renilla levels. Significant differences between sample groups were assessed by one-way analysis of variance followed by the Bonferroni post-hoc test.
Supplemental material